Optical Phenomena of Ducts
Introduction to ducts
What's a duct? It's a layer of air whose temperature gradient is
sufficiently steep to make the curvature of horizontal rays greater than
that of the layer, so that some rays get bent back to lower levels.
The cause of ducting is a thermal inversion with a lapse rate more
negative than about −0.11 K/m; see the
bending page
for numerical details.
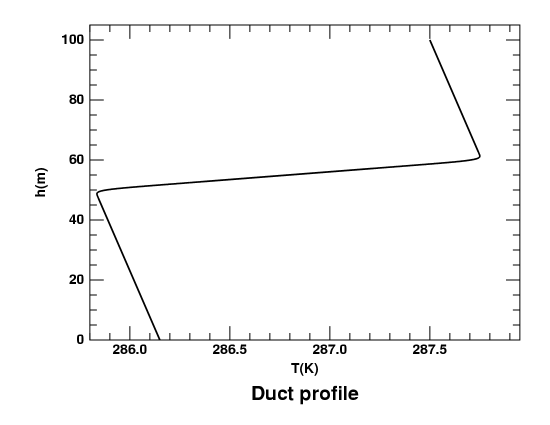 Here's the temperature profile for the rather modest duct I use to
illustrate ray paths in the superior and mock
mirages:
Here's the temperature profile for the rather modest duct I use to
illustrate ray paths in the superior and mock
mirages:
Basically, it's just a two-degree (Celsius) thermal inversion between 50 and 60
meters height, superimposed on the Standard Atmosphere. But, as explained
elsewhere,
the corners have been rounded off to allow for the real-world effects of
heat transfer.
Duct optics
Optical ducts produce a surprisingly complex set of phenomena. What you
see depends on where you are: above, below, or in the duct. The
observer's location is particularly critical near the bottom of the duct.
That's why this page is called “Optical Phenomena
of Ducts”
rather than “Optical Phenomena
in Ducts”.
Here, we have simulations of the effects of ducts on sunsets.
For ducts and mirages, see the other
duct page,
which shows ray-traces in ducts.
Discontinuous images
First, the duct produces discontinuities in the images.
That's because a ray that's horizontal just above the top of the duct
always remains above the duct; but a ray that's horizontal just below
the top of the duct gets bent downward in both directions. This second
ray meets the bottom of the thermal inversion at some considerable angle,
and propagates into atmospheric layers well below the inversion.
In this lower layer, the ray curvature is less than the Earth's
curvature, so the surface of the Earth gradually bends away from the ray.
If the duct is far enough above the surface of the Earth, these latter
rays eventually become parallel to the surface, and then ascend into the
duct again — whence they can be bent back down another time, and so
on, ad infinitum. Such rays are
trapped
in the duct forever (assuming the thermal structure that created the
duct goes on forever); see the
mirage page
for a ray-trace.
So an observer within the duct sees only trapped rays in a zone of
sky that is
symmetric
about the astronomical horizon. This zone of trapped rays is
Wegener's
“blank strip”.
(Indeed, it was Wegener who first pointed out these discontinuities.)
But even an observer above the duct sees discontinuous images:
a ray that's just tangent to the top of the duct is horizontal there, so
all rays higher in the observer's sky avoid the duct. But rays even a
little lower must enter the duct, where they receive a large angular
deviation. The refraction of all objects seen through the duct is much
greater than that of objects seen just above it; so again, the images are
discontinuous at the top of the duct.
Observers below the duct see a continuous, but highly
distorted, image of
the sky near the astronomical horizon.
Infinite refraction
There's another startling feature of refraction in ducts.
At the edge of the thermal inversion, there's always a height where the
ray curvature is exactly equal to the Earth's curvature. A
horizontal ray at the height must circle the Earth at constant height
“forever” (i.e., until it's extinguished by atmospheric
extinction.)
But, once again, you don't have to be exactly at this height to see the
phenomenon. Any observer above the duct can look just above it and
see rays that (in principle)
can approach the critical level and circle the Earth once, twice, …
before escaping back to space.
The closer you look to the top of the duct, the bigger the refraction
becomes — without limit!
In the real world,
extinction
prevents us from seeing rays that have had
refractions more than a few degrees. But even the rays we can see produce some
remarkable effects: images of the entire Sun
compressed to a thin line
at the top of the duct, for example.
Of course, these images occur at the edges of the image discontinuities,
producing some very startling effects.
[These circulating rays
were studied in a remarkable
paper by Kummer
in 1860. If you read German, it's a fascinating work. He shows that
circulating rays can produce an infinite number of images of
everything! The whole sky, and the whole surface of the Earth, are
re-imaged an infinite number of times, in his model.]
… and it's all modified by dispersion
As if these remarkable phenomena weren't enough, remember that the
refractive index of air depends on wavelength. That means all the
phenomena described above are different in different colors of light.
Combining the effects of dispersion with the monochromatic optics of ducts
produces the astonishing
sub-duct green flashes.
Examples
To illustrate the phenomena of ducted sunsets, here are some examples.
Each image has a short commentary to point out its significant features.
Because different phenomena are seen from different heights, I've made
different groups of simulations for the same atmospheric structure, as
seen from heights:
But, rather than jumping around, you'll see what's going on best by
viewing these cases in order. These links are provided so you can
go back and review them, if you want another look at one or two.
Bear in mind that the effective exposure of our simulated sunset camera is
increased automatically as the Sun sinks into the haze; the relative
brightnesses within each image are correct, but the brightness
changes from one image to the next mean nothing, because the “exposure”
is adjusted to show as much dynamic range as possible.
It's simplest to begin with the observer well above the duct, and then move
the eye down, because things get more complex near the bottom of the duct.
Sunset seen from 100 meters height
This sunset has an aerosol scale height of 1 km, and an
optical depth
above the observer of 0.035. These values correspond to clear conditions,
and make the increased extinction below the duct obvious, without
obscuring things too much.
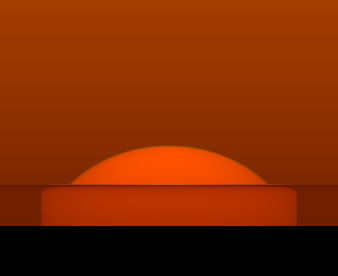
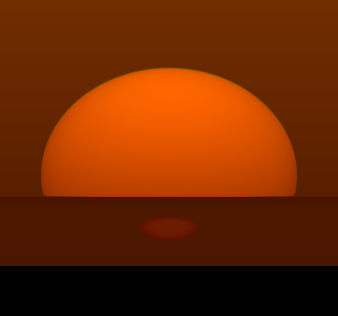
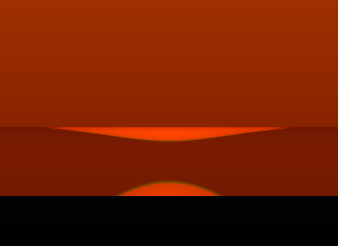
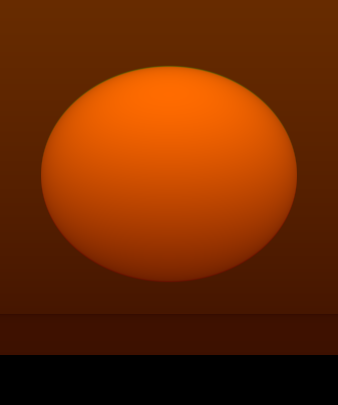 In the image at the right,
the true altitude of the Sun's center is −25′ of arc.
The low Sun appears flattened, as usual; atmospheric extinction dims and
reddens the lower limb. Even so, the color of the Sun is orangish, not
deep red: the air is unusually clear.
In the image at the right,
the true altitude of the Sun's center is −25′ of arc.
The low Sun appears flattened, as usual; atmospheric extinction dims and
reddens the lower limb. Even so, the color of the Sun is orangish, not
deep red: the air is unusually clear.
The only indication of anything unusual is a slight change in brightness
of the sky, about halfway between the lower limb and the apparent horizon.
This is the discontinuous change in haze optical depth at the duct.
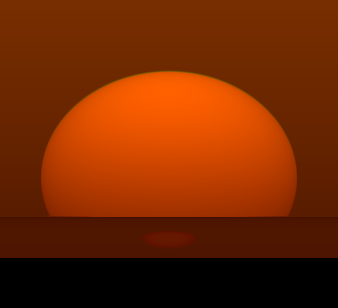 At the the left is the second image in this
sequence. The Sun's center is now 40′ below the astronomical horizon.
At the the left is the second image in this
sequence. The Sun's center is now 40′ below the astronomical horizon.
Part of the disk is now below the false horizon at the duct.
However, a mock mirage of the lower limb is beginning to appear in the
zone between the duct and the apparent horizon. Note that this dim image
shows an inverted image of the lower limb in its upper half, and an erect
(but vertically stretched) image of the same little piece of the lower
limb in its lower half. The sides of this little image are vertical at a
folding zone where there is infinite vertical magnification.
Under average conditions, the extinction might obliterate that mock-mirage
image completely. Then the false horizon at the duct would be interpreted
as the true apparent horizon — but it would have a dip several
minutes of arc less than normal.
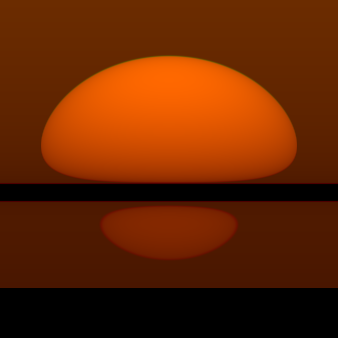
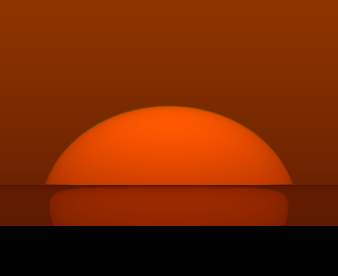 In the image at the right, the Sun's center is 50′ below
the astronomical horizon. This depression corresponds to the
standard tables for the
nominal time
of sunset.
In the image at the right, the Sun's center is 50′ below
the astronomical horizon. This depression corresponds to the
standard tables for the
nominal time
of sunset.
About half the disk is now below the duct.
The mock mirage of the lower limb has become a large blob that nearly
fills the space between the duct and the apparent horizon.
You can see that the inverted image of the lower limb has become very
compressed just below the duct. The vertical magnification changes rapidly
from great expansion (in the middle of the sub-duct zone) to great compression
(just below the duct.)
Also, the infinite refraction at the duct makes a dark line in the sky,
which is now more visible because the increasing exposure is making the
sky features more obvious.
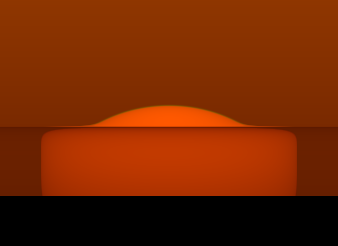
 When the Sun's center is 56′ below the astronomical horizon,
the part below the duct appears nearly rectangular.
That's because the center of the Sun is at the zone of maximum vertical
magnification, and the inverted image of the lower limb (just beneath the
duct) is strongly compressed.
When the Sun's center is 56′ below the astronomical horizon,
the part below the duct appears nearly rectangular.
That's because the center of the Sun is at the zone of maximum vertical
magnification, and the inverted image of the lower limb (just beneath the
duct) is strongly compressed.
If you look closely, you can see that the part of the solar image just above
the duct shows thin “spikes” or “whiskers” that extend
the full width of the Sun, beyond the cap of disk that remains above the duct.
These are caused by the infinite refraction just above the duct.
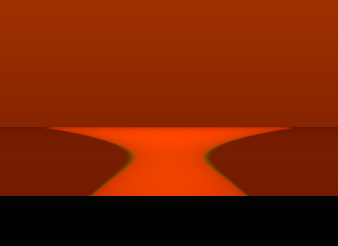
 At a depression of 56′,
the part below the duct is beginning to shrink. The “waist” in this
image is at the fold line, where the erect (lower) and inverted (upper)
images of the lower limb join.
At a depression of 56′,
the part below the duct is beginning to shrink. The “waist” in this
image is at the fold line, where the erect (lower) and inverted (upper)
images of the lower limb join.
The part of the solar image just
above the duct is now reduced to a thin line that's barely visible in this
image. If the aerosol extinction were greater, or if the aerosol were
more concentrated below the duct, this bright line would be more
conspicuous.

 Here's a series of 3 images, showing how the waist below the duct breaks.
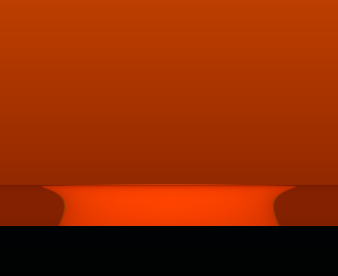
At a depression of 71′, the waist has narrowed down.
At a depression of 72′, the waist has broken, but the two parts are
still visible.
At −73′, the part below the break has vanished below the
apparent horizon, leaving just a thin red strip below the duct.
This strip is the inverted (i.e., mock-miraged) image of the disappearing
upper limb. (The image that was above the duct has now
disappeared, extinguished by the ever-increasing extinction as it
approaches the duct from above.)
Here's a series of 3 images, showing how the waist below the duct breaks.
At a depression of 71′, the waist has narrowed down.
At a depression of 72′, the waist has broken, but the two parts are
still visible.
At −73′, the part below the break has vanished below the
apparent horizon, leaving just a thin red strip below the duct.
This strip is the inverted (i.e., mock-miraged) image of the disappearing
upper limb. (The image that was above the duct has now
disappeared, extinguished by the ever-increasing extinction as it
approaches the duct from above.)
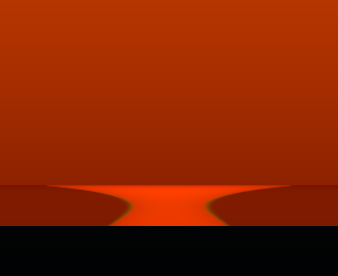
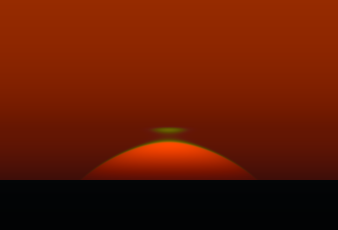
In principle, a faint green flash might be observed at the horizon under
extremely clear conditions; you can see a faint green rim on the
disappearing erect image of the upper limb in the second of these three images.
In practice, the large extinction beneath the duct makes
the green rim very faint.
So in practice, these flashes aren't observable.

You can see how this is going to end. The inverted image of the upper limb
fades away just below the duct, as its erect image above the duct
vanished, due to the increasing extinction that accompanies the approach
of refraction to infinity.
The clearer the air, the longer this process can be observed. This image
has a solar depression of 85′; if the air were clearer, it might be
followed to well over 90′. However, the image is very thin, because
the observer is so far above the duct. A lower eye level prolongs this
appearance, by increasing the angular thickness of the thin line.
Sunset seen from 65 meters height
Here's the
same atmospheric model, but seen from 65 meters height.
The haze model is also very similar, with 1-km scale height and
0.035
optical depth
above the observer — but now that's at 65 meters instead of 100.
Remember that the thermal inversion responsible for the duct extends from
50 to 60 m above sea level in this model. So our observer is now just 5 m
above its top. This makes the duct-top features considerably more visible
than they were from 100 m.
 This first image is for a solar depression of 20′.
It's similar to the first image in the previous sequence, but the duct
appears higher above the apparent horizon, because the observer is closer to it.
This first image is for a solar depression of 20′.
It's similar to the first image in the previous sequence, but the duct
appears higher above the apparent horizon, because the observer is closer to it.
 ←
At a solar depression of 34′, the mock mirage of the lower limb
appears in the sub-duct sky. Again, it's dim and red, because of the
large extinction.
←
At a solar depression of 34′, the mock mirage of the lower limb
appears in the sub-duct sky. Again, it's dim and red, because of the
large extinction.
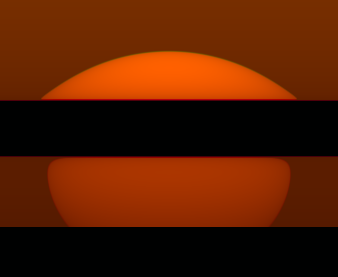
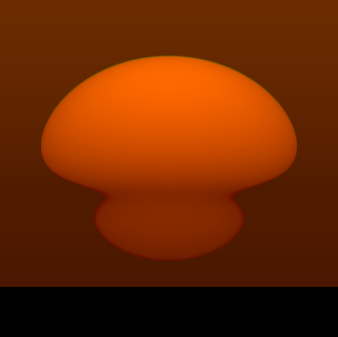
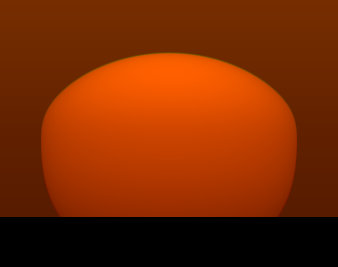
 At a solar depression of 50′, the mock mirage of the lower limb
below the duct
has become nearly rectangular.
At a solar depression of 50′, the mock mirage of the lower limb
below the duct
has become nearly rectangular.
The image above the duct shows the “spikes”
better than at 100m, because we are closer to the top of the duct.
(A photograph of a sunset like this is
shown
on Les Cowley's website.)
This image resembles the “tin hat” worn by the AEF in WW I,
as pointed out by
Willard J. Fisher,
in his description of Type B sunsets (which are also produced
by strong thermal inversions below eye level).
Fisher's Type B sunsets were usually observed from just a few meters
above a surface-based inversion, so they resemble this image with the
part below the duct cut off.
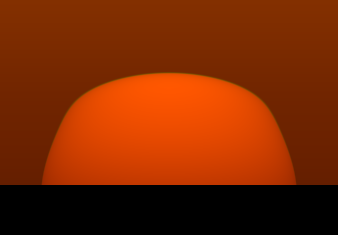
 At −55′, the image above the duct has shrunk to a thin, bright
line. The image below the duct is starting to become narrower, as the
upper half of the Sun descends through the mock-mirage zone of sky.
At −55′, the image above the duct has shrunk to a thin, bright
line. The image below the duct is starting to become narrower, as the
upper half of the Sun descends through the mock-mirage zone of sky.
 These four images, in 1′ steps from −65′ to −68′,
show the breaking of the neck between the erect and inverted parts of the
mock mirage. The interval between successive images is 4 or 5 seconds of
time at low latitudes.
These four images, in 1′ steps from −65′ to −68′,
show the breaking of the neck between the erect and inverted parts of the
mock mirage. The interval between successive images is 4 or 5 seconds of
time at low latitudes.
 The erect image of the upper limb at the apparent horizon takes longer to
set than it did at 100m, because the observer's lower position makes the
duct appear higher above the apparent horizon here.
The erect image of the upper limb at the apparent horizon takes longer to
set than it did at 100m, because the observer's lower position makes the
duct appear higher above the apparent horizon here.

As before, the sunset ends in a thin line that fades away
at the duct, as this image at −80′ shows.
And once again, there's no green flash for this observer.
An animation of a similar sunset (the same atmosphere, but seen from 70 m
height instead of 65 m) is
available.
Sunset seen from 50 meters height
Now, let's move down into the duct itself. You might think the middle of
the duct would be the middle of the inversion layer; but, as the duct is
caused by the bending the inversion produces, its effects are strongest at
the
bottom of the inversion — in this case, about 50 meters.
So let's take that height as the place to see the maximum effects of
ducting. (We continue to use the same atmospheric model as before.)
As Wegener showed, an observer
in the duct sees a
“blank strip”
at the astronomical horizon.
In this strip are the trapped rays; as they can't get out of the duct, none of
them can lead back to the Sun (or any other astronomical object). So the
sky seems to be split apart at the astronomical horizon: everything that was
close to the duct in the sky (as seen from above the duct) gets shoved
aside. That means there's strong image compression near the blank strip,
both above it and below it.
 Here's the Sun when its center is geometrically 15′ below the
astronomical horizon. Notice how much flatter it is on the bottom than in
similar views for an observer above the duct: that's the image compression
at work.
Here's the Sun when its center is geometrically 15′ below the
astronomical horizon. Notice how much flatter it is on the bottom than in
similar views for an observer above the duct: that's the image compression
at work.
Also, see how the discontinuity in sky brightness
at the duct has been replaced by a gap in
the bright sky: the blank strip. Distant terrestrial objects in the duct
can be seen miraged in this zone; we don't have any in the simulation,
however.
But that dark strip in the sky becomes really interesting when the Sun
crosses it, as in the next images.
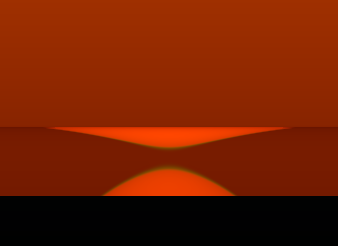
 Here on the right is the Sun when its center is geometrically 30′
below the
astronomical horizon. Its lower limb is completely squashed against the
top of the blank strip. In addition, a mirage of the lower limb, heavily
reddened, is appearing below the strip.
Here on the right is the Sun when its center is geometrically 30′
below the
astronomical horizon. Its lower limb is completely squashed against the
top of the blank strip. In addition, a mirage of the lower limb, heavily
reddened, is appearing below the strip.
This mirage is a curious mixture of mock mirage and Wegener's
Nachspiegelung. Notice that the image compression
applies to it, on the upper (inverted-image) side, where the strip is
squeezing it together.
As in the previous series, the image below the duct is much dimmer than
the part above the duct, because of the greatly increased airmass in the
line of sight.
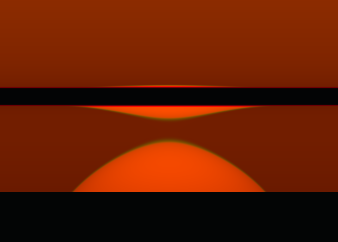
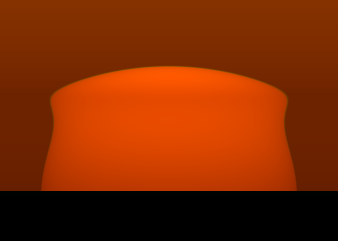
 At −40′, the Sun looks like a pot with a lid, separated by the
blank strip. The lower limb is now below the apparent horizon; and the Sun's
center is compressed beyond visibility on top of the strip. The lip of the
“pot” is of course part of the inverted image of the lower limb.
At −40′, the Sun looks like a pot with a lid, separated by the
blank strip. The lower limb is now below the apparent horizon; and the Sun's
center is compressed beyond visibility on top of the strip. The lip of the
“pot” is of course part of the inverted image of the lower limb.
 At −50′, the lid of the pot is flattening out and about to
disappear. The sides of the pot are now beginning to shrink together at
the fold line between erect and inverted images of the upper half of the
Sun.
At −50′, the lid of the pot is flattening out and about to
disappear. The sides of the pot are now beginning to shrink together at
the fold line between erect and inverted images of the upper half of the
Sun.
This image shows, more plainly than the previous ones, the red edges of the
blank strip. The reason is dispersion: the strip is wider at short
wavelengths, because the refractive index is bigger there. So there's no
blue or green light at the edges of the blank strip in red light; the only
thing seen at these edges is long-wavelength images of the Sun.
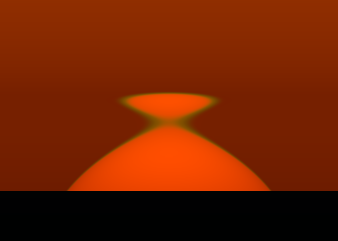
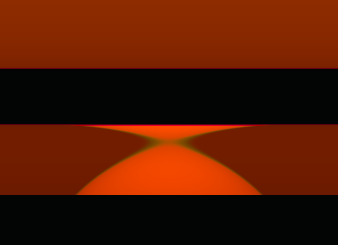 At −61′, the lid of the pot has vanished, and the sides
have collapsed to a point. Nothing remains visible above the blank strip.
The crossover, just below the strip, marks the fold line: the part of the
Sun above it is an inverted and highly distorted image of the upper limb,
just as the larger part below the crossing point is an erect and highly
distorted image of the upper limb. The green fringes that flank the
crossing point are distorted images of the green rim — but, once
again, are too dim to produce a visible green flash.
At −61′, the lid of the pot has vanished, and the sides
have collapsed to a point. Nothing remains visible above the blank strip.
The crossover, just below the strip, marks the fold line: the part of the
Sun above it is an inverted and highly distorted image of the upper limb,
just as the larger part below the crossing point is an erect and highly
distorted image of the upper limb. The green fringes that flank the
crossing point are distorted images of the green rim — but, once
again, are too dim to produce a visible green flash.

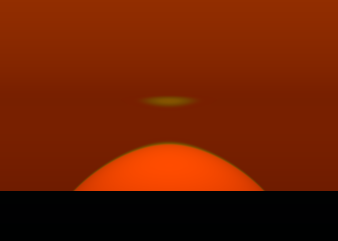
 At −65′, the erect image is about to disappear at the
horizon, while the inverted image is fading fast as a thin red line
just below the blank strip.
At −66′ (right image), this process is nearly complete; a tiny
wisp of green rim is just vanishing at the apparent horizon.
At −65′, the erect image is about to disappear at the
horizon, while the inverted image is fading fast as a thin red line
just below the blank strip.
At −66′ (right image), this process is nearly complete; a tiny
wisp of green rim is just vanishing at the apparent horizon.
This sunset can be seen as a simple
animated cartoon.
It gives a good impression of the relative speed at which the features
develop, but of course the intensities are all wrong, so the extinction
features that were pointed out above are not represented correctly.
Sunset seen from 46 meters height
The observer remains
within the duct, but
below the
inversion layer, for several more meters. Here's the view from 46 m,
just above the bottom of the duct, and about 4 m below the inversion.
 With the Sun 15′ below the astronomical horizon, its image is
entirely above the blank strip, which is now much narrower.
The flattening of the lower limb is, as expected
from the previous case, considerable.
→
With the Sun 15′ below the astronomical horizon, its image is
entirely above the blank strip, which is now much narrower.
The flattening of the lower limb is, as expected
from the previous case, considerable.
→
 ←
At −30′, the Sun is split into two unequal images. The upper
one, above the blank strip, is a distorted but entirely erect image; the
lower limb is strongly flattened by the strip. The lower image is a
doubled partial image of the lower limb; the lower part of it is erect, and the
upper part, just below the blank strip, is miraged (inverted) by the
Nachspiegelung.
(See the mirage
page for a ray-trace of the
Nachspiegelung.)
←
At −30′, the Sun is split into two unequal images. The upper
one, above the blank strip, is a distorted but entirely erect image; the
lower limb is strongly flattened by the strip. The lower image is a
doubled partial image of the lower limb; the lower part of it is erect, and the
upper part, just below the blank strip, is miraged (inverted) by the
Nachspiegelung.
(See the mirage
page for a ray-trace of the
Nachspiegelung.)

At −50′, the nominal depression at sunset, we still have several
minutes of arc of solar image above the blank strip, which itself extends
several minutes of arc above the astronomical horizon (its centerline).
This shows how much refraction the duct has added to the “normal”
value.
Note that the red edges of the strip are more pronounced in this case.
This is an example of the increase in dispersion effects at the bottoms
of ducts.
At −60′, the erect and inverted images of the upper limb below
the blank strip have separated; but there is still some of the limb
left above it. This produces an interesting triple image of the upper
limb.
However, the subsequent development is not very interesting. The thin
stripes flanking the blank strip become narrower and fade away, while the
piece of upper limb at the apparent horizon simply sets and disappears,
without producing a green flash.
Sunset seen from 45 meters height
Now let's move down just
one more meter, to 45 m height.
This is enough to put the observer just
below the duct, so it
closes up the blank strip.
You wouldn't think a shift in position of a single meter would make a
major difference in the sunset's appearance, but it does.
Let's have a look:
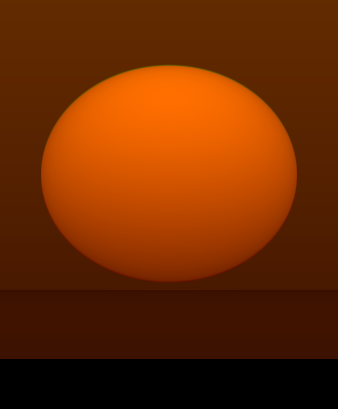
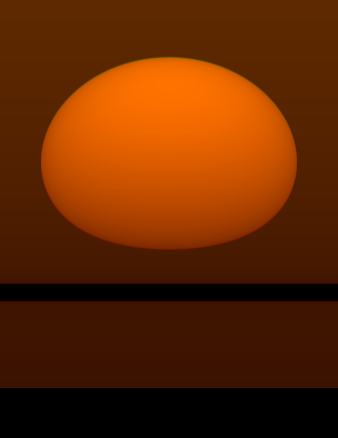
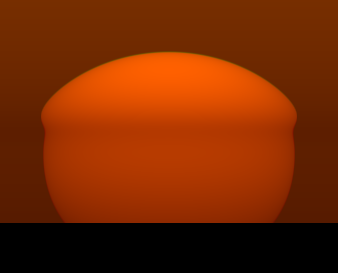
 This first image isn't very startling. The Sun (at −15′) is
strongly flattened on the bottom, but that's what you'd expect
in this situation.
This first image isn't very startling. The Sun (at −15′) is
strongly flattened on the bottom, but that's what you'd expect
in this situation.
As we are now below the duct, it's no longer marked by a line in the
sky, because we no longer have a line of sight that's
tangent to its surface. So this is a pretty unexciting picture, apart
from the rather large flattening of the Sun's lower limb.
 ←
At −30′, the closure of the blank strip has made the image
mapping smooth and continuous; so the Nachspiegelung of the
lower limb now joins smoothly with its erect image immediately above.
Nothing very startling there, either.
←
At −30′, the closure of the blank strip has made the image
mapping smooth and continuous; so the Nachspiegelung of the
lower limb now joins smoothly with its erect image immediately above.
Nothing very startling there, either.
However, there is a harbinger of things to come. Notice how much wider
the red rim on the lower part of the image is than the green rim on top:
the dispersion effects are large in the Nachspiegelung zone.
Notice, too, that a vertical line placed across the edge of the lower
bulge can intersect the same point on the lower limb three times: once in
the inverted part of the image, and twice in the erect parts, above and
below it. This will shortly have interesting consequences.
 ←
At −40′ we have the pot-with-a-lid appearance again, but this
time the lid is firmly joined to the pot.
←
At −40′ we have the pot-with-a-lid appearance again, but this
time the lid is firmly joined to the pot.
At −50′ the sides are beginning to shrink in, as the middle of
the Sun lies below the Nachspiegelung zone.
→
However, you can now begin to see what will happen: when the top of the
Sun reaches the region of triple images, it can pinch off and produce a
green flash. And the part of that green flash in the zone of enhanced
dispersion effects can be larger than usual.
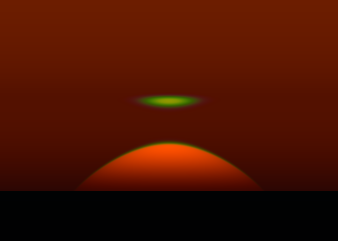
 Sure enough, a blob pinches off at the top of the Sun at −59′,
and turns green at −59.9′.
And what was a wide red rim on the lower limb has now become a wide green
rim on the upper.
Sure enough, a blob pinches off at the top of the Sun at −59′,
and turns green at −59.9′.
And what was a wide red rim on the lower limb has now become a wide green
rim on the upper.
 The last two images here show the evolution of that green flash at
−60′ and −60.1′. But it still remains visible
until −60.3′. This is the sub-duct flash.
(An even larger example is shown here .)
The last two images here show the evolution of that green flash at
−60′ and −60.1′. But it still remains visible
until −60.3′. This is the sub-duct flash.
(An even larger example is shown here .)
Those images are for the same atmosphere model we've been using, with a
haze optical depth of 0.035 above the observer, and a haze scale height of
a kilometer. The flash looks a lot better if we trap most of the haze
below the inversion, though. Let's cut the scale height to 50 meters, and
reduce the opacity above the observer to 0.004:
 ←
That's the same sub-duct flash as in the image directly above it;
the Sun is at −60′. The only difference is in the haze model
— here I've tweaked it to suppress the red disk at the horizon and
reduce the brightness of the red aureole, so that it doesn't dilute the
flash as much as before.
←
That's the same sub-duct flash as in the image directly above it;
the Sun is at −60′. The only difference is in the haze model
— here I've tweaked it to suppress the red disk at the horizon and
reduce the brightness of the red aureole, so that it doesn't dilute the
flash as much as before.
After the flash shrinks to nothing, it's an ordinary sunset.
The remaining disk sets at the apparent horizon by −65′.
 On the other hand, this sub-duct flash is already a lot nicer than a
mock-mirage flash, even though this was a fairly weak duct of only 2°
(here's a mock-mirage flash, with a similar aerosol model, for comparison):
→
On the other hand, this sub-duct flash is already a lot nicer than a
mock-mirage flash, even though this was a fairly weak duct of only 2°
(here's a mock-mirage flash, with a similar aerosol model, for comparison):
→
Notice how puny the mock-mirage flash (right) looks, compared to the sub-duct
flash (above).
An important difference between these two flashes is their horizontal
width, which is an indication of how long they last. (The duration
depends on how thick the miraged green rim is, which determines how long
it takes to set or disappear; but that also determines how wide the flash
is from left to right, because the Sun's radius is fixed.)
Sub-duct flashes can last a lot longer than the ordinary green-rim flashes
due to inferior mirages and mock mirages.
Sunset seen from 40 meters height
Now let's move down a few more meters, to 40 m. At this height, the
effects of the duct are much weaker. I'll just show a couple of
images for solar altitudes that were most sensitive to the duct, above.
(We're back to our usual haze model once again.)
 The images above for solar depressions of 30′ were all marked by
strong mock-mirage and/or Nachspiegelung effects.
Here's the view from 40 m for that depression.
The images above for solar depressions of 30′ were all marked by
strong mock-mirage and/or Nachspiegelung effects.
Here's the view from 40 m for that depression.
There's certainly some distortion. And, if you recall the appearance at
this depression from higher elevations, where there was a miraged image
below the duct, you can see a hint of that effect here. But there's no
miraging.
At −40′, there's still a hint of the pot-with-a-lid effect.
But it's just a hint, here.
→
←
At −50′, the Sun looks a bit square-shouldered.
You can see this isn't leading to anything interesting. The disk is a bit
mis-shapen, but it's not spectacular. There's no hint of a green flash in
the works; the Sun just sets and that's it.
This last case illustrates how overwhelmingly important the layers near
eye level are on the shape of the sunset, and the occurrence of green
flashes. There can be all sorts of interesting thermal structure in the
atmosphere; but if it's more than a few meters (or a fews tens of meters,
at most) above you, its effects are quite small.
A technical discussion of why the layers near and below eye level are so
much more important than the upper atmosphere is in my
2004 paper
in the Astronomical Journal.
Copyright © 2005 – 2010 Andrew T. Young
Back to the . . .
GF pictures page
or the
main simulation page
or the
GF home page
or the
website overview page