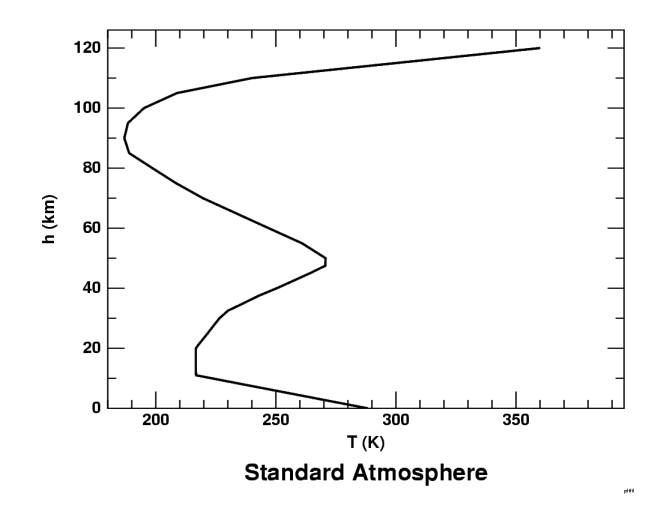
Here's the temperature profile for the Standard Atmosphere. If you're a physics or math type, you may be momentarily confused by the layout of the axes: though height is normally considered the independent variable, it's plotted on the vertical axis here. It's standard practice in the atmospheric sciences to make the height axis vertical, so we'll use that convention.

The part of most interest here is the lowest section, where the lapse rate is 6.5 K/km. This is supposed to be a typical value throughout the bottom 10 or 15 km of the atmosphere, where daytime convection stirs things up.
But this is only about 2/3 of the dry adiabatic lapse rate, which is what we'd have if the atmosphere were free of water vapor and thoroughly stirred. A considerable part of the discrepancy is due to the release of latent heat as warm, humid air is convected from the lower levels to higher ones: when the air cools to the point where condensation of water vapor into cloud droplets occurs, the latent heat is released to become “sensible heat”. If the cloud becomes dense enough to rain out, much of the heat that was released remains in the upper air.
Often, the convective columns overshoot during the day, and the air subsides after sunset, warming the air and evaporating what's left of the cloud. The result of this is that the clear air through which we get to see sunsets is usually fairly stable, even if it does not contain temperature inversions.
Because the lower atmosphere is continually overturned by convection, it's called the troposphere. The cold, dry region above it is the stratosphere. Above about 20 km height, you can see a warm region, where the atmosphere is heated by absorption of sunlight by ozone; this is the infamous “ozone layer” that has been modified by man-made pollution.
These upper layers contribute little to atmospheric refraction, partly because they are much less dense than the troposphere, and partly because any line of sight from the ground crosses the upper layers at angles farther from grazing.
Notice that this profile is physically impossible, because it has sharp, angular corners. As explained on another page, heat transfer in the real atmosphere necessarily makes all changes in lapse rate smooth, not abrupt like this.
For many purposes, the smooth transition regions are too thin to worry about. Typically, they are only a meter or two in thickness; this would not be visible at the resolution of the plot shown above. But they play an important part in producing visible features in mirages and sunsets, if these regions occur close to the observer. For example, the width of the mock-mirage flash depends on these transitions; and they produce enormous refraction at the edges of ducts.
But the lowest corner in the Standard Atmosphere profile occurs at 12 km, which is so far above most observers' heads that the corners shown here would have no effect in actual sunset and mirage simulations. So, in doing such calculations, I usually adopt the Standard Atmosphere profile in the upper atmosphere, and adjust just the lowest parts to produce the features I'm studying.
… what is needed is … merely a law that can be conveniently applied and which is sufficiently in concordance with the means adhered to. By this method, corrections due to temperature will be as small as possible in calculations of airplane performance, and will be easy to calculate. …
The deviation is of some slight importance only at altitudes below 1,000 meters, which altitudes are of little interest in aerial navigation. The simplicity of the formula largely compensates this inconvenience.
The above quotation is from the paper by Gregg (1920). The early motivations for this simplified model were evidently the calibration of aneroid altimeters for aircraft, and the construction of firing tables for long-range artillery, where air resistance is important.
Unfortunately, it is precisely the inaccurate region below 1000 m that is most important for refraction near the horizon. However, the Toussaint lapse rate, which Gregg calls “arbitrary”, is now embodied in so many altimeters that it cannot be altered: all revisions of the Standard Atmosphere have preserved it.
Therefore, the Standard Atmosphere is really inappropriate for astronomical refraction calculations. A more realistic model would include the diurnal changes in the boundary layer; but these are still so poorly understood that no satisfactory basis seems to exist for realistic refraction tables near the horizon.
Copyright © 2002, 2004 – 2007, 2012, 2025 Andrew T. Young
or the
GF pictures page
or the or the GF home page