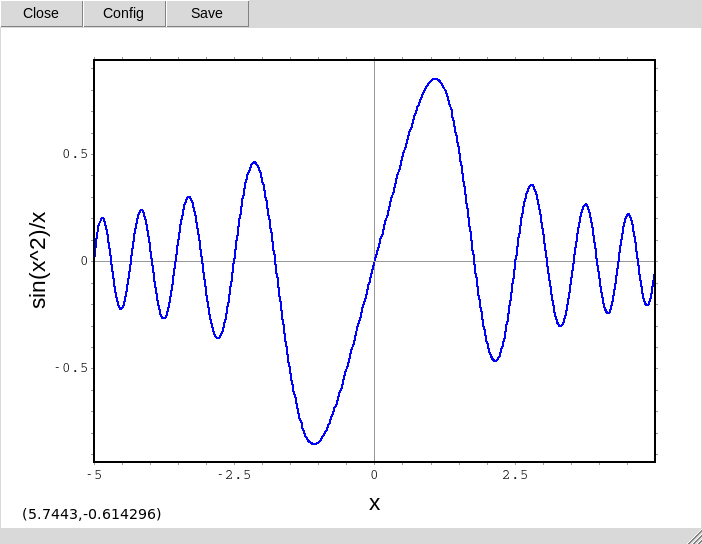
F(x):= (sin (x^2))/x;
at the (%i1) prompt. [ Notice the use of the
:= operator to define the function. ]
To plot a graph of this function, we can use the command plot2d, which requires that we specify the range of x to be plotted. The range is specified by a 3-item list: the name of the variable on the horizontal axis, followed by the lower and upper limits of its values. These 3 items are separated by commas, and enclosed in square brackets:
[x, -5, +5]
We also need to specify the format of the plot, because maxima by itself can't display a plot. If we have xmaxima installed, we can use the option
[plot_format, xmaxima]
(again, enclosed in square brackets, and separated from the x-range list
by a comma) to produce the plot. So the maxima command line is this:
plot2d (F(x), [x, -2, +2], [plot_format, xmaxima])$
The line ends with a dollar sign instead of a semicolon, because we don't
need to see the word "done" that is its result.
 The actual plot appears in a separate window, which is shown at the right.
I saved the plot by clicking on the "Save" button seen in its upper
margin.
Be careful about the plot window, which is produced by a separate process that remains even if you click on the "Close" button at its upper left corner.
Copyright © 2024, 2025 Andrew T. Young
Back to the . . .
MAXIMA Introduction page
or the
very basic Maxima page
or the website overview page