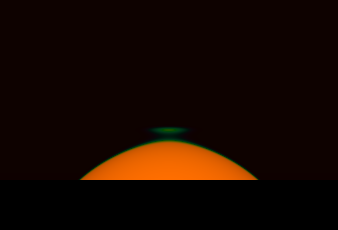


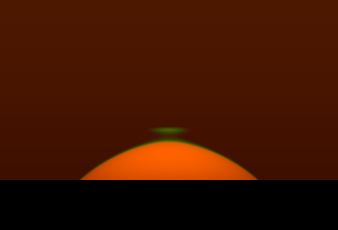


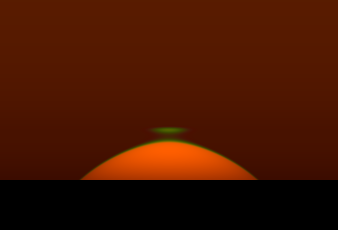


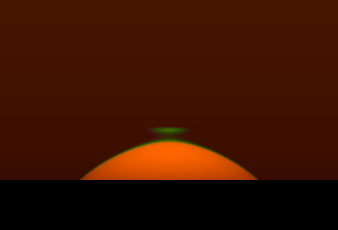
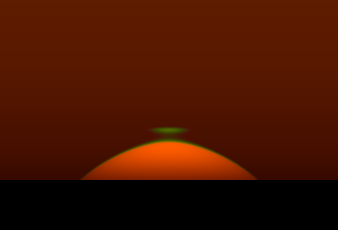
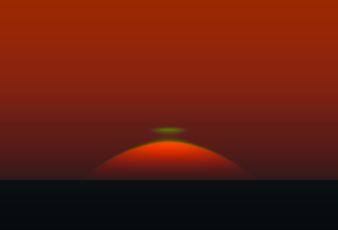


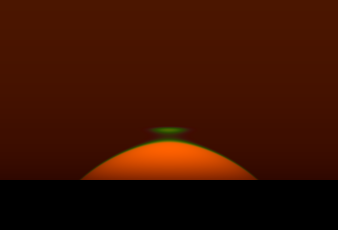

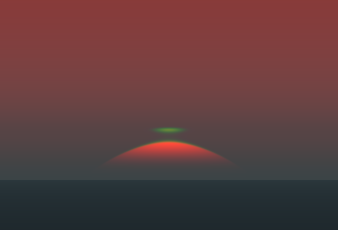


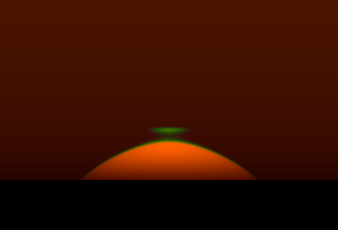


Here are simulations of the effects of aerosol extinction on mock-mirage flashes. The atmospheric thermal model is very simple: a thermal inversion of 0.8 K between 30 and 50 m height, superimposed on the Standard Atmosphere. The observer is 38 m above sea level, near the middle of the inversion layer.
Each image shows the mock-mirage flash at the moment when all wavelengths longer than 580 nm (nominally yellow light) have disappeared from the sunset mock mirage. The images in the rectangular array have:
So:
The amount of aerosol increases from left to right; and
The aerosol is more
concentrated toward the bottom of the atmosphere in the bottom rows.
The numbers in the column headings give the 550-nm optical depth at the observer's zenith. The lengths at the left give the aerosol scale height for each row.
IMPORTANT: the brightness scale is DIFFERENT for each image! Relative brightnesses are correct only within each image, not between images. Each image has been adjusted to make it as bright as possible without saturation.
| .001 | .002 | .005 | .01 | .02 | ||
|---|---|---|---|---|---|---|
| 1 km | |
|
|
|
|
|
| 100 m | |
|
|
|
|
|
| 70 m | |
|
|
|
|
|
| 50 m | |
|
|
|
|
|
| 40 m | |
|
|
|
|
|
| 30 m | |
|
|
|
|
|
| 25 m | |
|
|
|
|
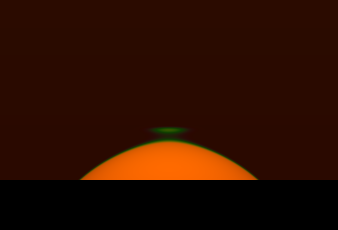
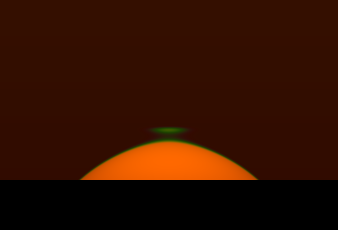
The images in the upper left corner are practically unaffected by aerosol effects: the sky is black, and the pure colors of the green flash and reddened Sun are produced entirely by molecular extinction and refraction. In the lower right corner, the haze is so dense that you see a nearly uniform diffuse fog-bank.
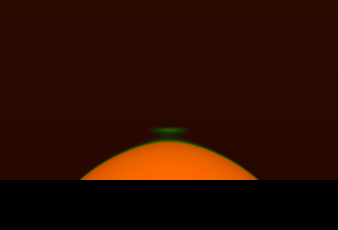
For small optical depths above the observer, the amount of haze below eye level increases steadily as the scale height of the haze decreases. That's why the haze effects near the apparent horizon become more pronounced as you go down any individual column (in which the haze above eye level is held constant). When the scale height of the haze is comparable to the eye height (38 m here), the amount of haze below eye level considerably exceeds that above. It doesn't take much haze to make the apparent horizon disappear entirely.
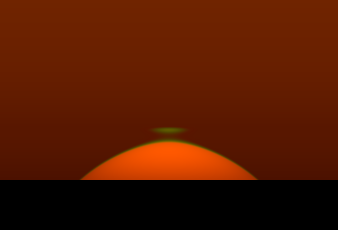
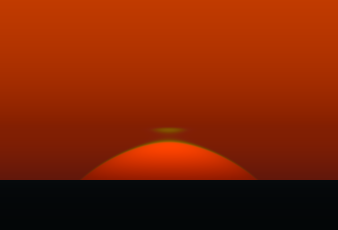
When the scale height of the haze is large compared to the eye height (e.g., the top row of images), the amount of haze at the apparent horizon isn't much different from that at the astronomical horizon (a little bit above the green flash). The sky is uniform; as the amount of haze increases, it remains red until the Sun is nearly lost in the haze. But when the aerosol is mostly below eye level, it becomes optically thick near the apparent horizon well before the Sun disappears. Then the haze is bluish — see the middle columns near the bottom of the array.
So a good rule of thumb is: when the sky around the Sun is red (i.e., dominated by the aureole), the aerosol is mostly beyond the horizon, and above your head. When it's bluish or gray, the aerosol is mostly between you and the horizon, and below eye level.
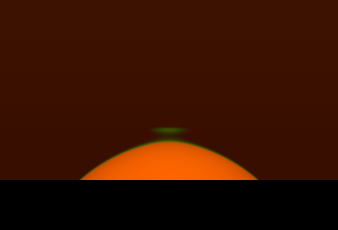
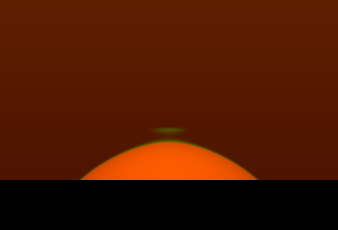
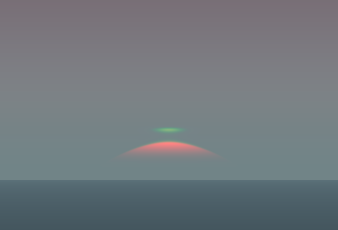
The former case also offers visible evidence of Laplace's extinction theorem. Look at the images where the green flash is still visible in a red sky, but the bottom of the Sun is disappearing into the haze (e.g., haze scale heights of 70 m or 100 m and zenith aerosol optical depth of 0.01, or 50 m scale height and zenith aerosol of 0.005). Just at the height of the green flash, there's a weak feature visible in the sky — like a little crease in the general sky-brightness gradient. (Scrolling the page up and down on the screen helps make this subtle feature more visible.)
That's because the green flash occurs at a local maximum in refraction. But Laplace tells you that the local maximum in refraction is also a local maximum in airmass , and hence extinction. That produces a little unevenness in the run of sky brightness there.
Evidently, there's information in the brightness and color of the sky. But a more careful treatment of the scattering would be required to model it accurately.
Copyright © 2005 – 2007, 2013, 2022 Andrew T. Young
or the
GF pictures page
or the
simulation details page
or the
GF home page
or the website overview page