 [A larger version that makes a better printed example is
here.]
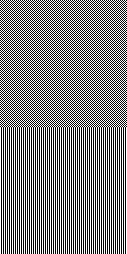
The upper half of this image is a checkerboard of alternating white and
black pixels. It therefore contains exactly the same number of black and
white pixels.
[A larger version that makes a better printed example is
here.]
The upper half of this image is a checkerboard of alternating white and
black pixels. It therefore contains exactly the same number of black and
white pixels.
You can download any of these images (all in PNG format for compactness) by right-clicking the mouse on one (in Mozilla; I can't help you if you use some other browser), and selecting the “Save Image As …” item from the menu that pops up.
To convert one of these PNG images to a halftoned PostScript file, you can do something like
anytopnm img.png | pgmtopbm -threshold -value 0.5 | pnmtops -equalpixels -dpi 300 > /tmp/img.ps
The −dpi argument of pnmtops should match the resolution of your printer.
Remember: your results will depend on your particular printer — how it's adjusted, what toner cartridge you use, etc., etc. — as well as the optical properties of the paper you're printing on. The only way to see what you get with different halftoning methods is just to run these tests and see what you get.
 Here's a grayscale showing all 255 shades of gray from 1 to 255.
A larger version, suitable for high-resolution printers, is available here.
[A larger version that makes a better printed example is
here.]
The upper half of this image is a checkerboard of alternating white and
black pixels. It therefore contains exactly the same number of black and
white pixels.
The lower half contains the same alternation of white and black within each row of the image; but the rows are aligned, instead of being out of phase with their neighbors. As a result, the image consists of alternating white and black stripes, each 1 pixel wide.
Because both ends of the rows in the lower half-image are black pixels, each row actually contains 1 more black pixel than white ones. That makes the lower half-image a tiny bit darker, on the average, than the upper (checkerboard) half. Yet, when I print this pattern on my 300 dpi LaserJet III, the lower (supposedly darker) half of the image comes out a distinctly lighter shade of gray than the upper half.
Obviously, that's because the (oversized) black dots overlap more in the lower half-image, where they're aligned in stripes: each black pixel has an adjacent neighbor that's just the pixel spacing (1/300 inch) from it, center-to-center. In the (upper) checkerboard pattern, the black pixels are √2 times as far from their nearest black neighbors; so they overlap less, and cover a larger fraction of the total area.
If the halftoning algorithm does not take dot overlap into account, there is no way to predict the alignment of the dots in successive rows of the halftoned image. Unfortunately, this means that the printed shade of gray is not exactly predictable from the shade in the original image. It also means that uniform gray regions will often appear to contain a fine pattern of subtle horizontal stripes, as the white and black pixels in adjacent rows fall in and out of step. It depends on the halftoning algorithm used. I've noticed this is a particular problem with the default Floyd-Steinberg halftoning of the pgmtopbm program.
If you're using an old 300dpi laser printer, it might be better to use the −hilbert option to pgmtopbm , if that's the program you're using to convert grayscale to halftoned images. Sometimes a smaller clump size than the default 5 will give acceptable uniformity and less graininess, so see what works best for your particular situation.
As some modern printers have a built-in halftoning algorithm that allows for the printer's properties, it could be that letting the printer do the halftoning might be best — contrary to the claims on the pgmtopbm man page.
Here are some test patterns to check your printer for these. The test images are scaled to work well on 300-dpi printers, but might be useful at higher resolutions if you're careful.
T. N. Pappas & D. L. NeuhoffPappas and Neuhoff show some simple patterns of stripes printed on an old 300-dpi printer (HP LaserJet II), which uses the same Canon SX engine as my HP LaserJet III. While some of the peculiarities shown in their Fig. 1 are explained by the dot-overlap model, others are not.
“Model-Based Halftoning”
in Human Vision, Visual Processing, and Digital Display II
(Proc. SPIE, Vol. 1453, 1991) pp. 244–253,
 In particular, they show a patch of alternating white and black lines that
came out blacker than a solid black patch, or a patch that was nearly all
black, but with every 6th line white.
In particular, they show a patch of alternating white and black lines that
came out blacker than a solid black patch, or a patch that was nearly all
black, but with every 6th line white.
Here's an image to test for that problem. The top section is solid black; the middle has every 6th column white; and the bottom has every other column white. A good printer should print the top section solid black, and the other two in progressively lighter shades of gray. (Pappas and Neuhoff's printer would have made the bottom section the darkest instead of the lightest.)
Pappas and Neuhoff suggest that the peculiarities of their printer would require a model that takes into account more than 3 adjacent pixels; but it looks to me more like a problem we used to have with early Xerox machines, which had difficulty in copying solid-black areas.
I see a hint of that problem when I hold my printed page up to the light: I can see a darker border, where the toner is a little heavier, all around the dark image. But it isn't obvious in ordinary, front-illuminated viewing when the printer is normally adjusted (i.e., so that the wiggly-line field on the test page looks right). However, when the printer is reset to its nominally darkest setting, these dark borders become very obvious — but, even then, the interiors of the dark areas seem to print normally.
It appears that the early Canon laser engines had problems that have been resolved with the better remanufactured cartridges. I'm using refills sold by LaserSaver here in San Diego; I notice their refills print considerably darker than the original HP cartridges did. Supposedly, the differences are mostly due to improved toner. (I'm also printing by means of the plug-in PostScript II cartridge, but I doubt that it makes any difference in rendering such images.)
In any case, the adjacent image allows you to see for yourself whether
you have a problem. The fine white lines in the lower sections
should print cleanly, and the lower panels should look progressively
lighter than the solid black upper part. My LJ III printer passes this
test.
 Here's an image to see how severe these effects are for your printer.
Print it out as described
above.
Here's an image to see how severe these effects are for your printer.
Print it out as described
above.
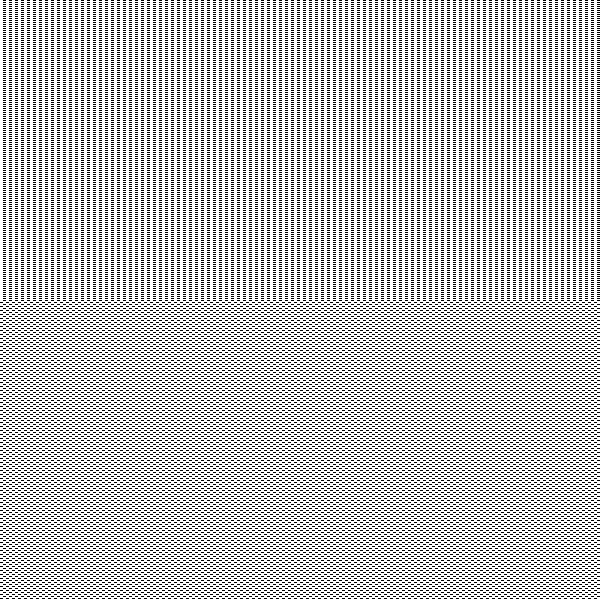
The top half contains dashes of 3 black pixels and 3 white pixels, alternating with all-white rows; the dashes are aligned with those 2 rows above or below them, so they line up in columns.
The bottom half has the same density of 3-pixel groups, but now they're out of phase with the ones 2 rows apart. If scattering effects are negligible, the two halves of the image should print the same average shade of gray. (With a 300-dpi printer, you'll need to view the printed page from a meter or more away to make the columnar structure in the top half invisible.)
Because each group of black pixels is completely surrounded by white ones, there should be no dot overlap between neighboring groups, so long as the dot-overlap factor ρ (described below) does not exceed 1.4.
On my HP LaserJet III, the two patches print nearly the same shade of gray. The top half of the image is slightly lighter, though; this might indicate an effect of “optical dot gain”, or it might be that the dots in successive rows occasionally encroach on one another, decreasing the total blackened area slightly. (I notice that my printer doesn't print the rows exactly evenly spaced.) In any case, the effect is so small, especially compared to the dot-overlap effect, that I'll ignore it.
The effect will be larger at higher resolutions. For example, when I print this image on an HP 2420dn printer (normally 600 dpi, but capable of true 1200 dpi, according to HP), there's a large difference between the two patches when the image is printed at 1200 dpi. If I scale the image to 600 dpi, there's only a slight difference between the patches on that printer in its normal 600 dpi mode, but a larger difference in 1200 dpi mode. Apparently, the printer is somehow averaging the dots and printing a mixture of large and small dots to achieve the correct effect when printing in 600-dpi mode.
On the other hand, a higher-resolution printer may have more dot overlap to begin with, which could be confused with optical-scattering effects if this image is printed at the full printer resolution. So you might want to try printing this at 300 dpi (selectable with the -dpi option to pnmtopbm) even if your printer has more resolution.
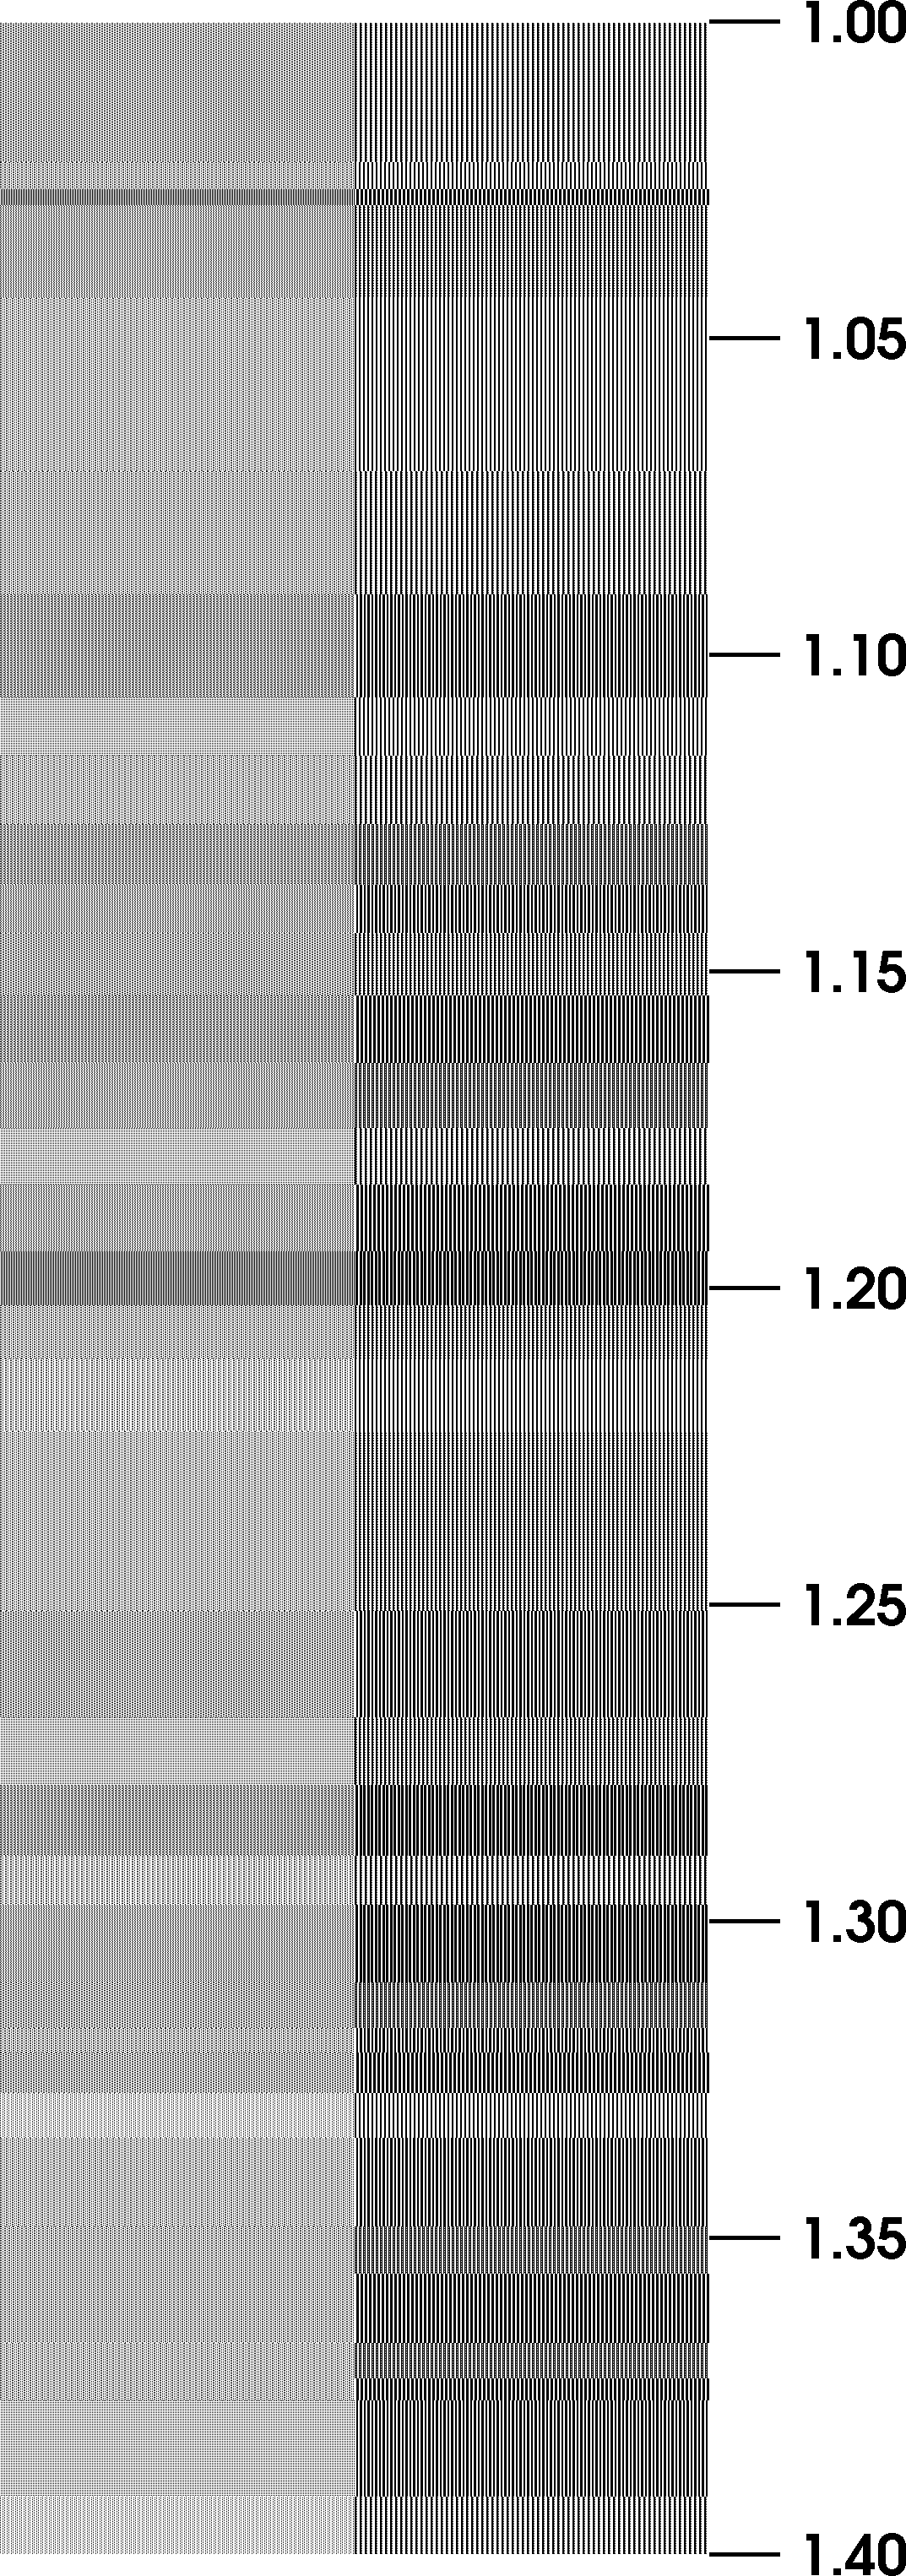
If you can take advantage of such a printer model — or if you're just curious about the size of your printer's dots — I've made a test image to help estimate the parameter ρ. (It's too big to show on the screen, but just right for a 300dpi printer.) As most people don't have a reflectance photometer handy to measure the average brightness of a halftoned patch, it's convenient to use a visual comparison, much like the test patches that are often used to estimate the gamma of monitors. Here, however, we're estimating the dot-size parameter ρ rather than gamma.
By the way, if you look at the test image on your computer screen, you'll notice that all the patches in the right column look darker than those in the left. That's because your monitor doesn't write black pixels on a white background, so it doesn't mix black and white pixels in the same way a printer does.
The calibration target shown here is based on the well-known fact that dispersed-dot patterns cover a larger fraction of the printed area with ink or toner than do clustered-dot patterns. (That's because isolated dots cover up white paper with their full area, while neighboring dots partly overlap, so that some of the blackening falls on area already blackened by an adjacent dot.) So, for the same fraction of pixels painted, a dispersed-dot pattern will look darker than a clustered-dot pattern.
Furthermore, the disparity increases with ρ, so that printed patterns with dispersed dots darken with increasing ρ much faster than do clustered-dot patterns. So the obvious way to proceed is to calculate, as a function of ρ, the average geometric coverage for a variety of dispersed and clustered patterns of dots, and then pick out pairs of dispersed and clustered patterns with the same coverage at some value of ρ. Such pairs ought to appear the same brightness when printed by a printer with that ρ value, if dot-overlap is the main effect at work.
Then just arrange the pairs in order of the value of ρ that makes the two patches appear the same brightness, print them on your printer, and look at the result. (I've adjusted the heights of the pairs of patches, to make a more or less uniform ρ scale; their heights vary, because the available values of ρ for matching pairs are not evenly spaced.)
For pairs that cover equal fractions of the paper at smaller values of ρ than your printer has, the dispersed-dot pattern (on the left side of the test image) will appear darker than the clustered-dot member of the pair. That's because your printer's higher ρ has made the dispersed pattern much darker than it would have been at the crossover value, while the clustered pattern is only a little darker. Conversely, the dispersed-dot member of pairs that have equal coverage for larger values of ρ than your printer's value will appear lighter than the clustered member.
For convenience, I've appended a scale of ρ values along the right edge of the image. The ρ-value where the left and right patches appear equally dark is the value for your printer.
However, there are some exceptions. These tend to be the darker patterns, where single rows or columns of white pixels occur surrounded by black ones. These darker patches suggest a higher value of ρ.
This disparity indicates that optical-scattering effects or xerographic effects are affecting the printing; it isn't just a matter of dot overlap.
The LJ III has a little green dial you can turn to adjust the darkness of the printing. The test pattern shows that this controls the dot size. The value of ρ = 1.33 mentioned above is what I get with the dial set to 9, which gives the lightest printing. Setting it to 8 makes the print darker, but more so on the left half of the test page (i.e., the dispersed-dot patterns). The left and right patterns of each pair are equally dark only near the bottom of the page, so the effective value of ρ has increased to about 1.39. All the darker (i.e.,numerically smaller) settings make everything in the left column darker than the right: ρ is clearly greater than 1.40. So we can regard the green dial as a ρ-adjuster.
From this, we can draw the useful conclusion that halftoned images printed with the Canon engine will look best when the green dial is set to the lightest setting, which minimizes the dot-overlap problem — regardless of the halftoning algorithm used (unless it actually compensates for dot overlap).
Printing the 300-dpi image in normal 600-dpi mode, I get an image not too different from what the LJ III produces. The best value of ρ is a little smaller with the 2420 — I'd say about 1.27 — but the anomalous darkness of the darker patterns is much the same as with the LJ III.
However, when I convert the image to print at 600 dpi, and print it on the 2420 in normal 600 dpi mode, the results are quite different. First, there's much more inconsistency of the results, which seem to depend more on the average density of the patches than on anything else: the light patches are much too light in the left column, and the dark ones there are much too dark. Still, there's some indication that dot overlap is important as well: the right-hand patches are all darker than the left ones for ρ > 1.20, and the reverse is true for ρ < 1.10. So a value of ρ near 1.15 seems called for. All the patches print darker at this resolution, which is to be expected if dot-overlap is important. But it seems odd that a smaller value of ρ fits the 600-dpi image better than the 300-dpi image.
Printing the 600-dpi image again, but this time at the printer's full 1200-dpi resolution, the whole image is slightly but appreciably lighter. The density-dependence of the left-hand column seems to be reduced. And the best-fitting value of ρ is about 1.15 again.
Finally, scaling the image to 1200 dpi and printing it in 1200-dpi mode, the entire right-hand column is darker than the left! The first two patches at the top of the image are about equal in brightness, so I have to assume that the best value of ρ is just about 1.00 exactly -- an unexpected result. The variations in brightness in the left-hand column are now quite extreme, too.
Apparently, this printer uses variable-sized dots, and no simple model using overlapping disks of constant size is a good description of the printer's behavior.
To make good targets, we need patterns with short cycle lengths, to take advantage of the low-pass spatial-frequency properties of the visual system. Periods longer than 5 or 6 pixels (at 300 dpi) begin to be pretty obvious to the eye, at normal reading distance. (I had to resort to somewhat coarser patterns in a few cases, such as the ones in the right column of the test image at the 1.20 and 1.30 tick-marks.)
                x . . .
		. . x .
                x . . .
		. . x .
The period of this pattern is just 4 pixels horizontally and 2 pixels vertically; it looks quite uniform when printed. A typical 300dpi laser printer with ρ = 1.25 covers about 61% of the paper with toner, even though only 1/4 of the pixels are nominally blackened.
Clustered-dot patterns should preferably be one-dimensional (i.e., made up of parallel lines). Vertical lines, for example, completely hide the dot growth with ρ at the tops and bottoms of the painted pixels. For example:
		x . . x . .
		x . . x . .
		x . . x . .
		x . . x . .
That has single black columns separated by two white ones. (The black encroaches on the white, so the average coverage is about 56%, even though only 1/3 of the pixels are black.) The period is only 3 pixels.
Though pure stripes of small period look quite uniform, there are only a few possibilities. We can get more gray levels, and hence more possibilities of matching pairs of dispersed and clumped dot patterns, by adding an occasional painted pixel in the white stripes, provided these are adjacent to a black line. We can also put an occasional black pixel in a narrow white stripe between two black ones, so that both left and right sides of the added pixels overlap their neighbors. Here's an example of such a “ladder” pattern:
		x x x . . x x x . .
		x . x . . x . x . .
		x x x . . x x x . .
		x . x . . x . x . .
		x x x . . x x x . .
The period is 5 pixels horizontally and 2 vertically; typical blackening is 66%.
As there are only a small number of possible simple patterns of these extreme types, it's a simple matter to compute the blackening of each as a function of ρ and pick out the pairs of curves that cross.
Copyright © 2006 – 2008, 2012 Andrew T. Young
or the
introduction to image scanning
or the
GF home page
or the website overview page