Mirages Produced by a Smooth Temperature Profile:

Height-of-Eye Variations

Introduction

After the zigzag model, a still more realistic temperature profile is a smooth one.

The one used here is a 2° thermal inversion between heights of 50 and 60 m, but with the corners at those two heights smoothed. That's the model used to make ray-trace diagrams on the mock-mirage page. It's also the model used to simulated a ducted sunset; that sunset page shows the actual temperature profile used here.

As usual, the inversion is represented by a shaded band in the ray diagrams; remember that the duct actually extends below this band.

This model produces a duct that extends down to about 45.7 m height — about a foot higher than the bottom of the duct for the zigzag model based on the same 2° temperature difference. (The two models differ only near 50 and 60 m, where the smooth model has the corners of the temperature profile rounded off; that rounding-off makes the duct a little thinner here than in the zigzag model.) As on the other pages that use this model, as well as the introductory mirage page, the inversion layer, between 50 and 60 m height, appears as a shaded band in the ray diagrams here.

So the smoothed duct is almost as thick as the zigzag one. The main features, therefore, are similar to the ones produced by the zigzag model; so you should read the detailed discussions of that model to understand the causes of those features. As you'd expect, the main effect of rounding the corners of the temperature profile is to smooth the corners in the mirages. But there are some other differences, particularly where rays are nearly horizontal at the edges of the inversion.

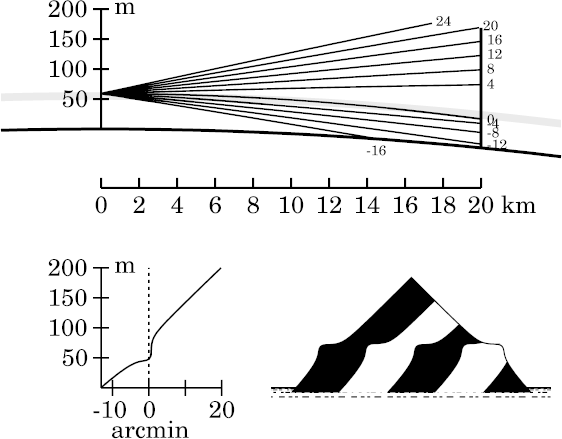
Once again, it's useful to see what happens as we move the observer up through the duct at two distances from the target. And, as for both Wegener's model and the zigzag model, I'll use 20 km and 40 km as the near and far target distances.

Target 20 km from observer

As before, we start out just below the duct, and work our way up.

200m target seen at 20km in smoothed duct model from 45m ht.

Eye at 45 m   (smoothed-inversion model)   [align]

As you should expect from the rapid decrease in sensitivity to atmospheric structure with height above the observer, this looks much like the corresponding cases in the zigzag model and Wegener's model. The discussions on those pages equally well explain what we see here.

As in the zigzag model, the horizon ray here is bent down continuously, instead of being refracted abruptly at Wegener's density discontinuity. But it ends up at about the same place on the target in all three models. At 45 m, we're just too far below the inversion to see the effects of its details.

Instructions for using the [align] links are found here.


200m target seen at 20km in smoothed duct model from 46m ht.

Eye at 46 m   (smoothed-inversion model)   [align]

Even at 46 m, there's nothing new: this looks very similar to the zigzag model at the same height. So the discussion there explains the imaging here equally well.

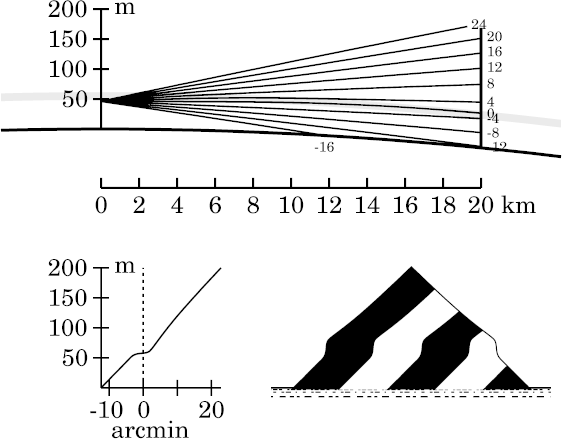
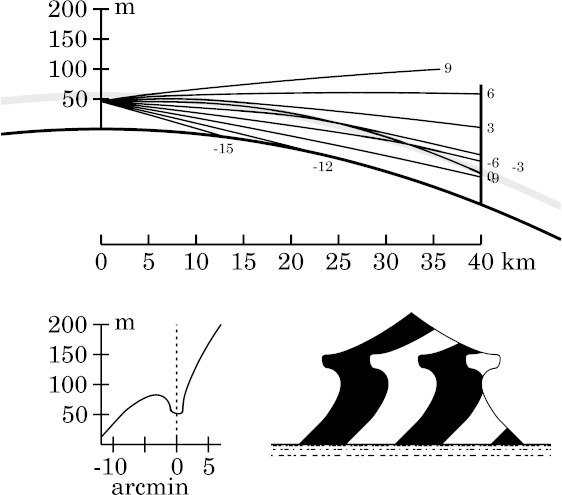
Although we're actually in the duct here, a target distance of 20 km is just too short to produce any miraging.

Furthermore, we're too far below the lower edge of the inversion to see any effects from smoothing its edges. So let's jump up to an eye height of 49 m, where some differences begin to appear.


200m target seen at 20km in smoothed duct model from 49m ht.

Eye at 49 m   (smoothed-inversion model)   [align]

At last, at 49 m, the observer sees a small difference in the image due to the smoothed edges of the inversion; compare the transfer curve and image here with those for the same case in the zigzag model.

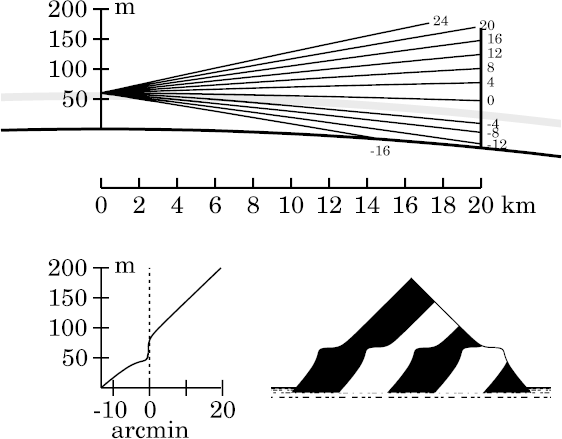
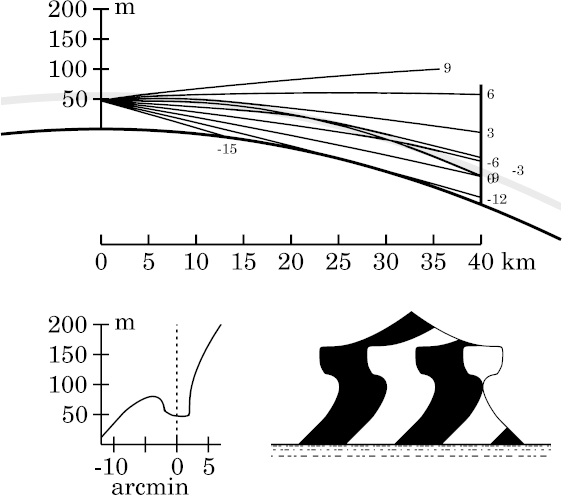
In the zigzag model, the discontinuity in lapse rate produced an angular corner near +3′ altitude. Here, that corner is rounded off. There's also a corner near the astronomical horizon; it, too, is smoother here.

Even though the observer is just a meter below the base of the thermal inversion here, these rounded corners are the only visible effects of smoothing the temperature profile.


200m target seen at 20km in smoothed duct model from 50m ht.

Eye at 50 m   (smoothed-inversion model)   [align]

At 50 m, the eye is at the base of the (unsmoothed) inversion — right in the middle of the smoothed region, in this model. Compare this mirage with the corresponding situation for the zigzag model. The prominent sharp corners in the zigzag model are now rounded off.

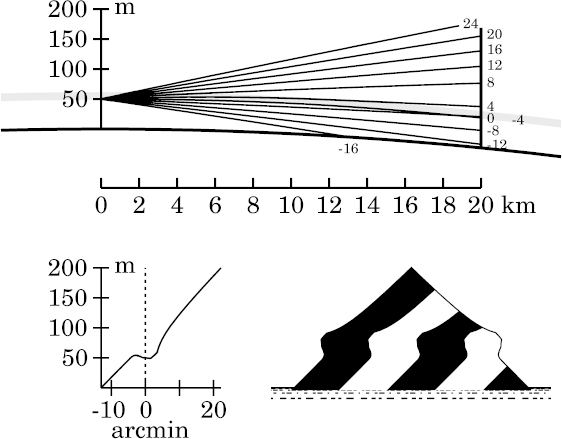
The suppression of the corners, which marked the boundaries between image zones with different vertical magnifications in the zigzag case, now makes the interpretation of the miraged image more difficult.

Furthermore, the complex fine detail near the astronomical horizon in the zigzag-model image has almost completely vanished.


200m target seen at 20km in smoothed duct model from 54m ht.

Eye at 54 m   (smoothed-inversion model)   [align]

As the observer moves up toward the middle of the inversion, and away from its lower edge, the effects of smoothing that edge again diminishes, becoming just a slight rounding of the corners in the transfer curve and the simulated image. We're still too far below the upper edge of the inversion for its smoothing to produce visible effects.

So this figure is fairly similar to the one for the zigzag model at the same geometry.


200m target seen at 20km in smoothed duct model from 57m ht.

Eye at 57 m   (smoothed-inversion model)   [align]

At 57 m, we're still too far from the edges of the inversion to see obvious effects of smoothing them. Compare this simulation with the corresponding one for the zigzag model, which shows a very slightly sharper corner near +2′ altitude, at the lip of the “normal” zone just above the astronomical horizon.

As in the zigzag model, the mirage has disappeared entirely at this short target distance.


200m target seen at 20km in smoothed duct model from 59m ht.

Eye at 59 m   (smoothed-inversion model)   [align]

So we can expect to see more effect from smoothing as we get closer to the upper smoothed edge of the inversion. Here, just 1 meter below the upper edge of the original unsmoothed inversion, we do see a smooth shoulder above the towered zone at the astronomical horizon. But that was already true for the zigzag model at this height; so there's not much change in appearance.

The real difference is that the vertical segment of the transfer curve (which is the flat, stooped part of the simulated image) is appreciably lower here — much closer to the astronomical horizon. That's because rounding off the corner in the temperature profile has moved the top of the duct down a fraction of a meter, so that it's nearly at the eye height here.


200m target seen at 20km in smoothed duct model from 59m ht.

Eye at 60 m   (smoothed-inversion model)

That means that an observer at 60 m height is actually above the top of the inversion, and so would see a ducted mock mirage if the target were far enough away. But at 20 km distance, we get only a steeply towered zone below the stooped one.

Here's a view of that situation, even though it technically should go on the ducted mock-mirage page. There's no simulation there for a target distance of 20 km, but you can interpolate between the ones at 15 km and 30 km to see what happens when the eye is 65 m high.

Notice that the vertical section of the transfer curve, and the corresponding “platform” in the mirage image, falls almost exactly at the astronomical horizon.


Target 40 km from observer

200m target seen at 40km in smoothed duct model from 44m ht.

Eye at 44 m   (smoothed-inversion model)   [align]

As you'd expect, there's no visible consequence of smoothing the edges of the inversion, even at 40 km. Here (at left) is what you get; compare it with the zigzag model.

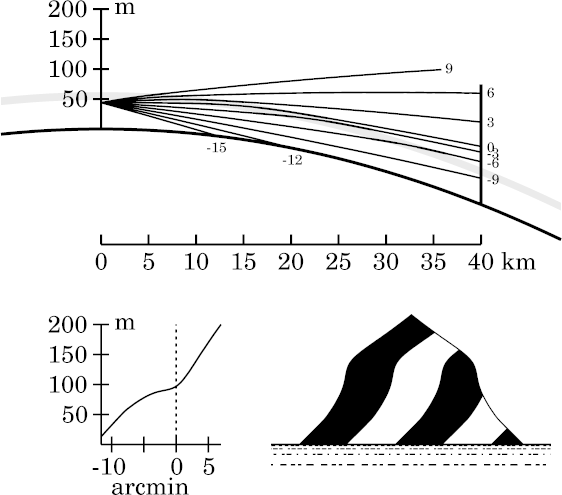
The lack of difference is hardly surprising.


200m target seen at 40km in smoothed duct model from 45m ht.

Eye at 45 m   (smoothed-inversion model)   [align]

Likewise, the sub-duct mirages are very similar. (On the right, the smoothed inversion; in the link, the zigzag model.)

There is a small difference: in the zigzag model, the contrast between the broad maximum in the transfer curve near −3′ altitude and the minimum near the astronomical horizon is a little bigger. That makes the mirage a little more distinct in the zigzag simulation.

Smoothing the edges of the inversion has effectively weakened it a little, making the mirage a little weaker here as well.


200m target seen at 40km in smoothed duct model from 46m ht.

Eye at 46 m   (smoothed-inversion model)   [align]

At 46 m, we're just inside the lower edge of the duct. But because smoothing the inversion made the duct a little thinner, this height puts the observer a little closer to the bottom of the duct here than in the zigzag model. So the blank strip is appreciably narrower here.

And of course there's the expected smoothing of the corners here as well.

(For simulations at different distances from the observer at this height, see here.)


200m target seen at 40km in smoothed duct model from 47m ht.

Eye at 47 m   (smoothed-inversion model)   [align]

With the eye at a height of 47 meters, the miraged strip appears a little wider than it did at 46-m eye height, and the observer is farther above above the base of the duct; so the thinning of the duct due to smoothing the inversion is less obvious than it was at 46 m. (Compare with the zigzag model at the same geometry.)

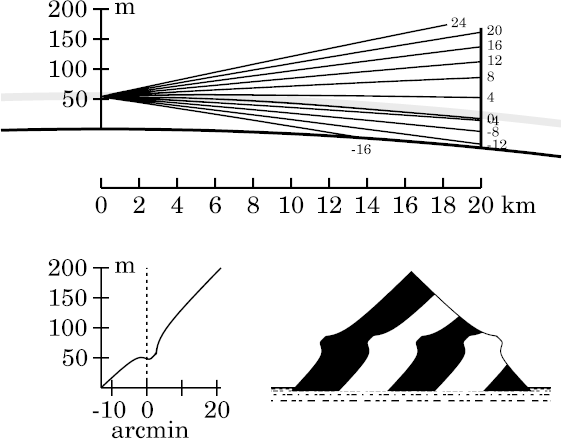
Even so, Wegener's blank (or miraging) strip is appreciably narrower here, in the smoothed model, than in the unsmoothed, zigzag model. The difference is particularly obvious at its upper edge: more of the middle dark stripe on the target is visible just above the upper edge of the strip (above the right-hand white stripe) here than in the zigzag case. This difference will continue to be visible at greater eye heights.

The rounding of the corners is quite obvious, particularly at the lower edge of the blank strip.


200m target seen at 40km in smoothed duct model from 48m ht.

Eye at 48 m   (smoothed-inversion model)   [align]

As we approach the lower edge of the inversion, where the blank strip containing the superior mirage has its maximum width, we again see that smoothing the inversion has reduced its effective thickness, and therefore the width of the strip. As at 47m, slightly more of the top of the target is visible above the miraging strip than in the corresponding zigzag case. (This is best seen just above the top of the rightmost white stripe on the target.)

Smoothing the inversion also has made the upper edge of the strip less sharply defined, so there's now more slope to the nearly-vertical part of the transfer curve near +2′ altitude.


200m target seen at 40km in smoothed duct model from 49m ht.

Eye at 49 m   (smoothed-inversion model)   [align]

Similarly, at 49 m, the strip is both slightly narrower and slightly smoother than in the zigzag model.

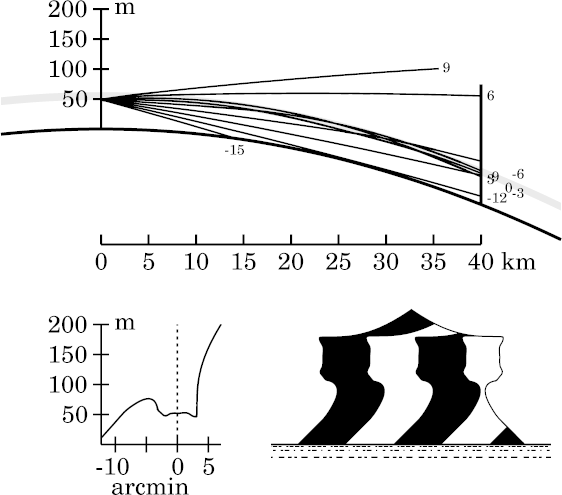
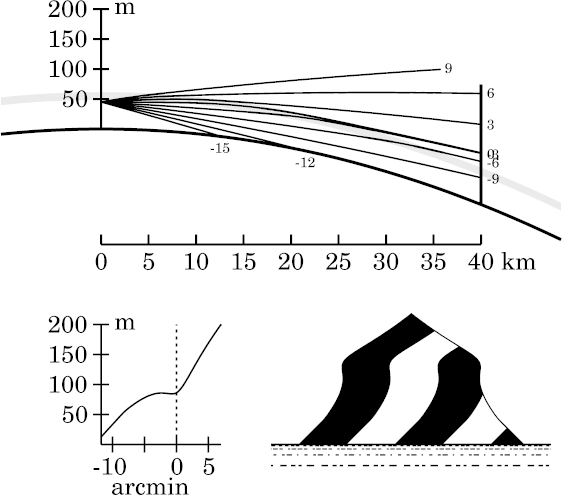
The smoothing has also subtly modified the effects of Wegener's periodicity effect on the ducted rays near the astronomical horizon. These rays now appear to fill the duct more uniformly than in the zigzag case.


200m target seen at 40km in smoothed duct model from 50m ht.

Eye at 50 m   (smoothed-inversion model)   [align]

At the base of the inversion, these smoothing effects are most visible. The miraged strip is appreciably narrower here than in the zigzag model, and the details — especially near the horizon ray — are considerably smoother. In the ray diagram, the −3′ ray, which almost coincided with the other ducted rays near the target in the zigzag simulation, is well separated from them here, between 35 and 40 km from the observer.

200m target seen at 40km in smoothed duct model from 54m ht.

Eye at 54 m   (smoothed-inversion model)   [align]

But higher up, these effects diminish again. At 54 m, the most visible effect of smoothing the inversion is at the top edge of the strip. Features near the lower edge of the miraging strip are less prominent at this eye height, so the narrowing of the strip is obvious only at its upper edge. Compare this image with the one for the zigzag model.

A set of simulations at this height (54 m) for this model at different distances from the observer is shown here.


200m target seen at 40km in smoothed duct model from 57m ht.

Eye at 57 m   (smoothed-inversion model)   [align]

As we approach the upper edge of the thermal inversion, the lower edge of the miraging strip disappears. The narrowing of the strip, due to smoothing the edges of the inversion, remains obvious at its top, both in the transfer curve and in the simulated image. (Compare this image with that for the zigzag model to see the effect.)

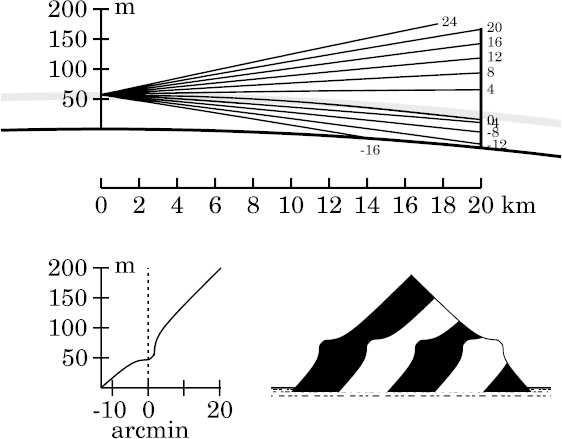
Paradoxically, smoothing the inversion has made the upper edge of the miraged image more acute.


200m target seen at 40km in smoothed duct model from 59m ht.

Eye at 59 m   (smoothed-inversion model)   [align]

As the observer approaches the top of the inversion, this sharpening of the upper edge of the miraged strip becomes more pronounced. Compare the pointy lip at the top of the mirage here with the lack of a sharp edge in the zigzag simulation.

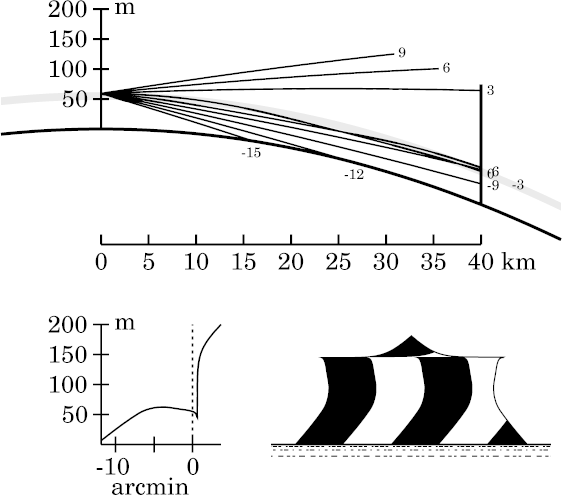
If you jump back and forth between the two images, you can see that the sharp edge here is essentially produced by a narrow zone of strong image compression (stooping) at the top of the strip: compare the transfer curves, just above the astronomical horizon.


And still higher…

This sharp lip in the image persists as the observer ascends above the thermal inversion. The image then becomes a ducted mock mirage; the simulation for an observer at 65 m height is shown on that page.

Concluding remarks

The effects of smoothing the edges of the inversion have modified the images most at the edges of the blank strip, and are more obvious for greater target distances. Therefore, some of these effects are better seen at greater distances than the 40-km range shown here.

You can see simulations for greater ranges, and the effects of range alone at fixed heights, on the distance-effects page for this model.


Copyright © 2008 – 2009, 2012 Andrew T. Young


Back to the . . .
introduction to superior-mirage simulations

or the introduction to all mirage simulations

or the main mirage page

or the GF home page

or the website overview page