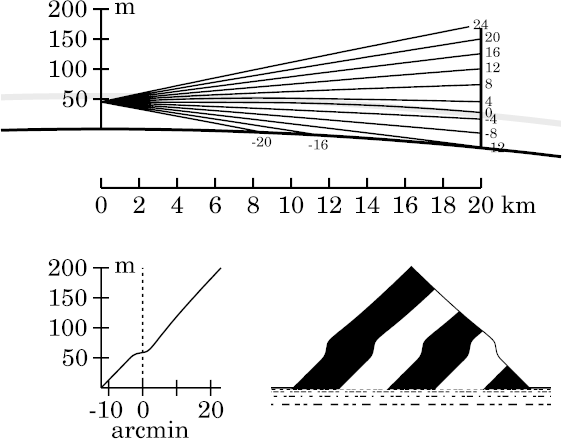
The particular example used here is a 2° thermal inversion between heights of 50 and 60 m. That's the simple model used to make some ray-trace diagrams on the introductory mirage page. This model produces a duct that extends down to about 45.3 m height — almost exactly where the bottom of the duct is for Wegener's model with the same 2° temperature difference. (The temperatures for the two models differ only in the 10-m interval between 50 and 60 m, and the mean temperatures in this interval differ by only 1°; so the pressures and densities are practically equal in both models above 60 m, as well as being identical below 50 m.) As on the introductory mirage page, the inversion layer appears as a shaded band between 50 and 60 m height in the ray diagrams here. (Remember that the duct actually extends below the bottom of this band.)
So the duct has practically the same thickness in both models. The only difference is that the zigzag model has a continuous transition through the inversion, instead of the Wegener model's discontinuity. But this difference drastically alters the mirages.
The changes in appearance with height of the eye are more complex here than they were for Wegener's toy model; so, once again, it's useful to see what happens as we move the observer up through the duct at two distances from the target. And, as for Wegener's model, I'll choose 20 km and 40 km as the near and far target distances.
Instructions for using the [align] links are found here.

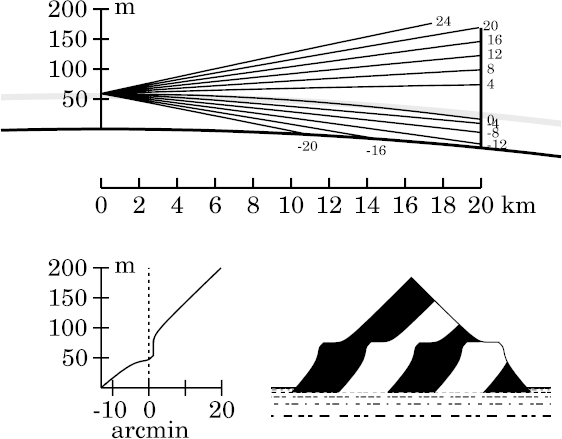
Notice that the astronomical-horizon ray here is bent down continuously, instead of being refracted abruptly at Wegener's density discontinuity. But it ends up at about the same place on the target.
However, once we enter the duct, there's an immediate difference: the view
from 45.5 m height showed a narrow miraging strip for
Wegener's model;
but for the zigzag model, there's no strip — indeed,
there's no mirage at all.
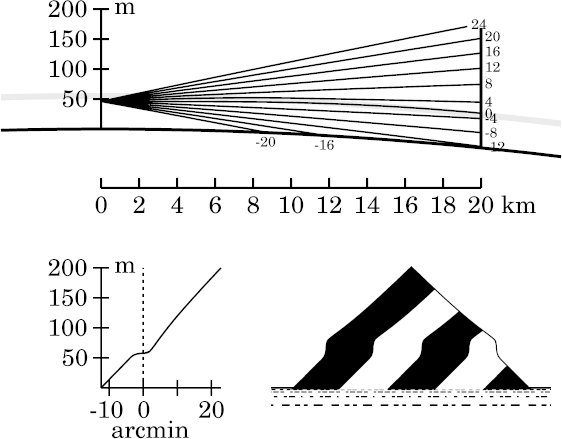
The ray diagram shows why. In Wegener's model, there's a sharp reflection of the astronomical-horizon ray when it strikes the top of the duct. But here, the steady density change through the inversion simply bends the ray down a little. As the bending is moderate, the ray's intersection at the target is only a little lower than when the observer was a meter lower. The net result is just slightly steeper sides on the towered section around the astronomical horizon.
The lesson here is that a discontinuous atmospheric model can produce discontinuous changes in the mirage with height; while a continuous model produces continuous changes with height.
Instructions for using the
[align]
links are found
here.
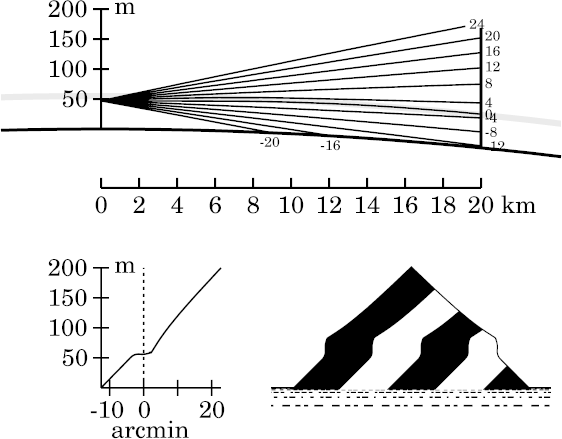
However, you can see that the astronomical-horizon ray is still above the middle of the inversion at the target here; so we can expect much more impressive results from this refraction at 40 km target distance than at the present range of 20 km. Though this page concentrates on height rather than distance effects, you can see this expectation confirmed by jumping ahead to 40 km target distance at this same eye height.
Incidentally, the vertical sides here show that the height where the
astronomical-horizon ray meets the target is an optical conjugate of
the observer's eye, at this distance (20 km).
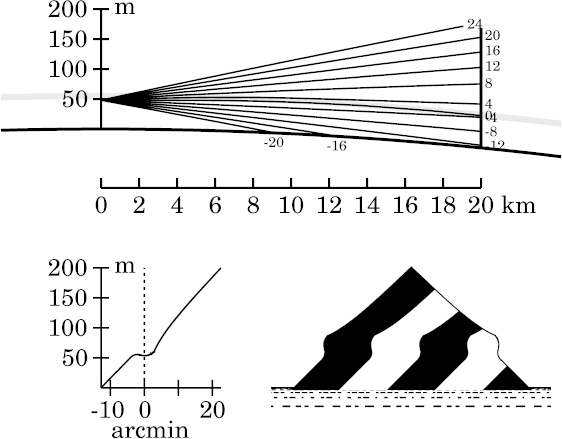
If we had plotted more rays (which would have produced a very cluttered ray
diagram), you'd have seen rays between 0′ and −2′
intersecting before the target, producing an inverted image in that
altitude zone.
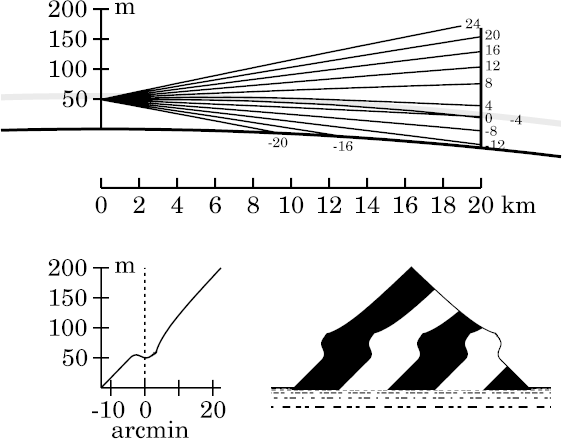
Above the astronomical horizon, the +4′ ray is now rather sharply bent down by its long path in the super-refracting inversion, so it falls much lower on the target than you'd expect from the rays above it. That compresses the target zone between +4′ and +8′, just above the corner in the image (and transfer curve) near +3′ altitude. Successively lower rays have more and more of their length in the inversion, and so continue to fall relatively far apart on the target, producing a strongly compressed (stooped) image zone.
But just a little lower, around +3′, the rays are completely in the inversion. Here the stooped zone ends abruptly, and is replaced by a short segment with almost normal slope.
At and below the astronomical-horizon ray, which meets the target near the base of the inversion, the process is reversed: successively lower rays escape from the bottom of the inversion before reaching the target, and experience progressively less refraction. Because of the rapidly decreasing refraction as we look lower, the rays actually intersect the target higher ; that is, the image is inverted. (As we are inside the duct, even though below the base of the inversion, this would be an example of Wegener's Nachspiegelung .) This is essentially the mock-mirage mechanism at work.
This continues down to an altitude of about −3′, where the
decrease in refraction within the inversion is no longer rapid enough
to overcome the increasing depression of the ray at the observer. So
there is a smooth change of slope in the transfer curve around this
altitude, and the normal erect image is finally seen below the distorted
zone.
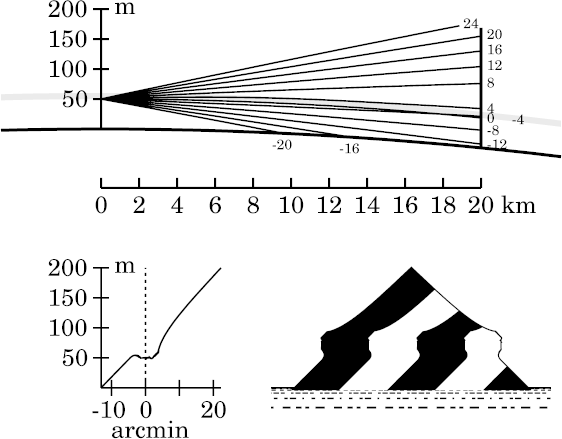
The corners in the transfer curve (and the image) that were noted above are now sharper. The miraged zone continues to produce 3 (or perhaps more) images.
Notice that the 0′ and −4′ rays, which intersected
about 19 km from the
49-m observer,
now intersect even closer to the 50-m observer here.
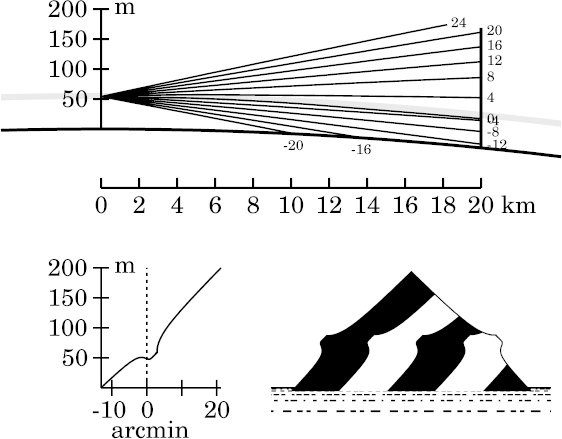
Notice that the 0′ and −4′ rays no longer intersect
before the target.
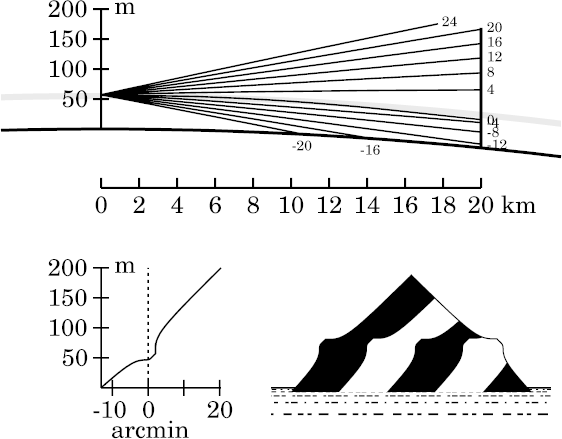
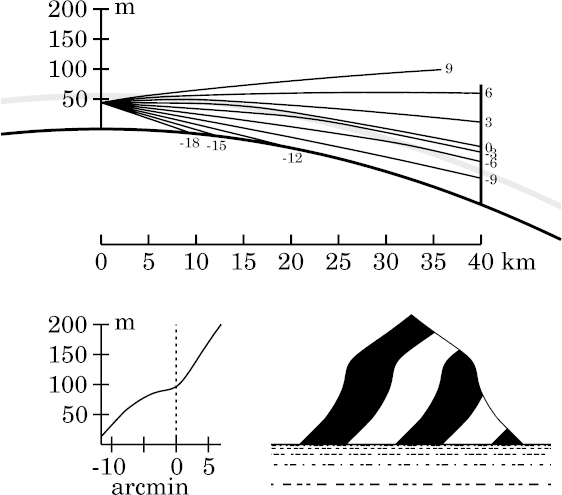
Once again, there is no mirage, and the image distortions are what we have come to expect when looking up through an inversion. The bottom 50 m of the target is practically undistorted, as it's seen through a piece of the Standard Atmosphere. The top is somewhat stooped — notice its obtuse apex angle — because its towering decreases with altitude, due to the decrease in incidence angle at the inversion as we look farther from the astronomical horizon. And the towering and looming of the middle part are generally similar to what was seen from just below the duct at this distance in Wegener's toy model.
None of that is surprising. What is surprising is what we see at
45 m height, one meter above this viewpoint.
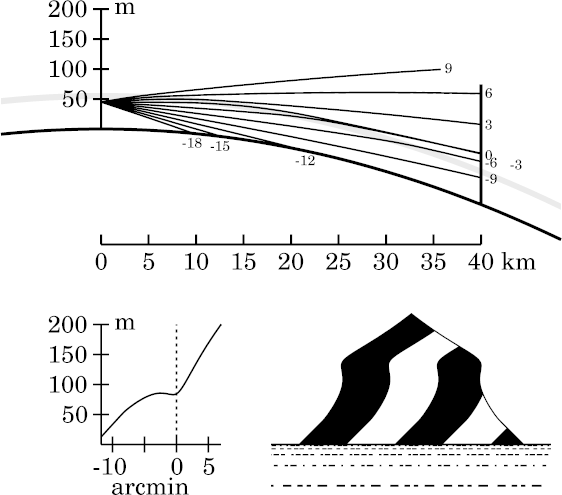
Yet there's a plain 3-image mirage here. Look how the horizon (0′) and −3′ rays cross, about 35 km from the observer.
How can this be? We're clearly below the duct: even the astronomical-horizon ray passes through the inversion, striking the target about 84 m above the ground (well above the top of the duct). There's no ray-trapping, no reflection; yet there is a mirage.
The answer is that the astronomical-horizon ray has a longer path in the inversion layer than the −3′ ray does. (The horizon ray enters the inversion closer to the observer; but the two rays leave the top of the inversion almost together.) So it gets bent a little more than the lower ray.
These two rays leave the top of the inversion between 25 and 30 km from the observer. The astronomical-horizon ray is still a little above the −3′ ray at 30 km, but it's sloping down a little more; so they cross a few kilometers before reaching the target. The ray diagram shows all these details, if you look closely.
This is the terrestrial counterpart to the mirage that's associated with the sub-duct green flash. Take a look at the simulated sunset for this same height, and you'll see this same mirage effect.
The mechanism for this mirage is the familiar one of the
mock mirage:
a longer path in the inversion, and so more bending, for a ray that's
higher at the observer.
In fact, it turns out that this is just the continuation of Wegener's
Nachspiegelung
below the duct.
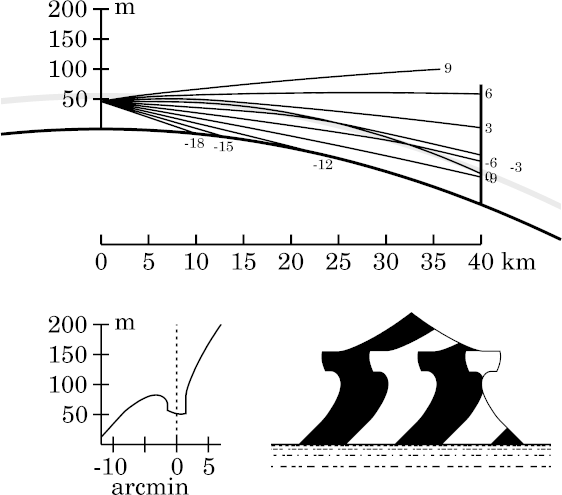
A narrow zone of rays around the astronomical horizon is likewise trapped, producing an inverted, towered image delimited by two lines parallel to the horizon. These lines mark Wegener's blank strip or “reflecting strip”, in which only ducted rays are visible to an observer in the duct, and which hides the Sun and other celestial objects. The inverted image below the lower edge of the strip is the Nachspiegelung .
Only two images are seen. The Nachspiegelung matches an erect image zone immediately below it; and the inverted zone in the strip matches a much lower section of the target's image. This zone is a textbook superior mirage.
Already at this height, we see that the superior mirage is appreciably distorted — the straight sides of the target appear curved — because Wegener's periodicity effect is at work.
That invites comparison with Wegener's toy model at the same eye height and target distance. The differences are striking: the toy model produced an erect mirage, while the zigzag model here gives an ordinary inverted image. We also notice how much more prominent the Nachspiegelung is in the zigzag model. Other differences include greater distortions here in the stooped zone just above Wegener's strip.
These differences basically arise from the milder action of the periodicity effect in the zigzag model. All the ducted rays have similar curvatures here inside the duct, so their refractions depend mostly on their path lengths in the inversion: the mock-mirage mechanism once again. But the path lengths differ only because the observer is below the base of the inversion; higher rays enter the inversion closer to the observer, so they bend down more. When the target is far enough away from the observer — as it is here — the extra bending can make the higher ray end up slightly lower on the target. (The differences are small, so only a narrow slice of the target appears in the superior mirage; this accounts for the towering in the strip.)
But because all the ducted rays have similar curvatures in the
inversion, the ones that enter at greater altitudes also reach greater
heights before being turned back down. (This differs from Wegener's toy
model, where all rays reach the discontinuity at the top of the
duct.) This greatly diminishes the variation in periods of different
rays. So the periodicity effect acts mainly to bend the transfer curve;
it isn't strong enough to re-invert the image and make the erect mirage we
saw in the toy model.
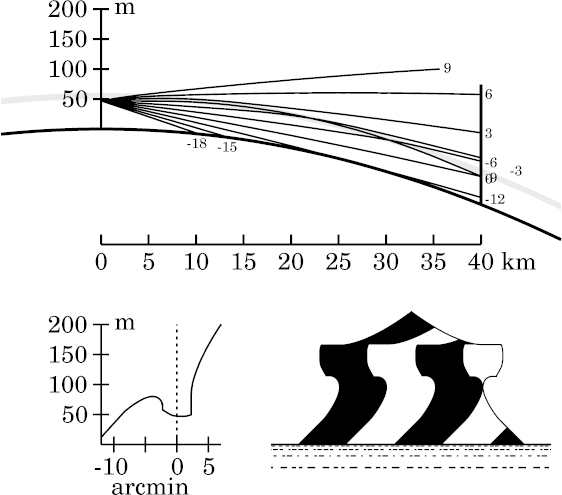
Comparison with the toy model shows a very different appearance: it shows hardly any Nachspiegelung ; an erect instead of an inverted mirage strip, etc. These differences illustrate a basic rule of refraction phenomena: it is the thermal structure near and below eye level that has the greatest influence on the image.
Here, the distortion of the miraged strip is strong enough to
produce almost infinite magnification in its upper half (i.e., above the
astronomical horizon). That's due to the periodicity effect, as we
approach the lower boundary of the thermal inversion. So we can expect
more complexity to develop rapidly with height.
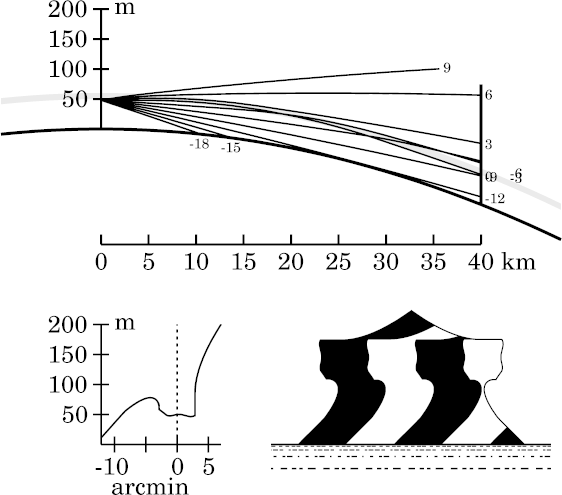
Multiple ray crossings are now beginning to clutter the ray diagram.
Notice the confluence of rays at the target near the base of the inversion
(50 m height). The towering is increasing.
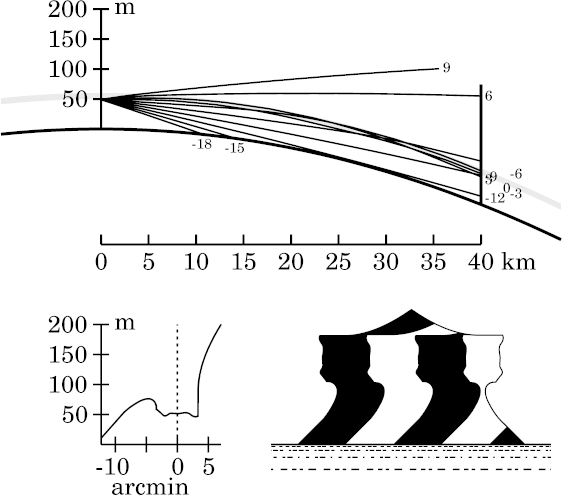
At this height, the miraged strip is wide enough that the rays 3′
from the observer's astronomical horizon are trapped in the duct.
This makes the ray diagram rather congested.
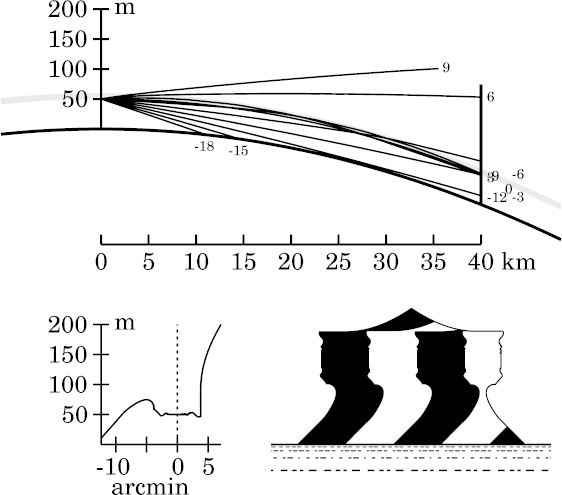
The top of Wegener's miraging strip is still well defined, but its lower edge is becoming much less prominent. The strip has its maximum angular width here, at the base of the inversion.
Of course, the appearance of the miraged strip in the
toy model
for this geometry is completely different.
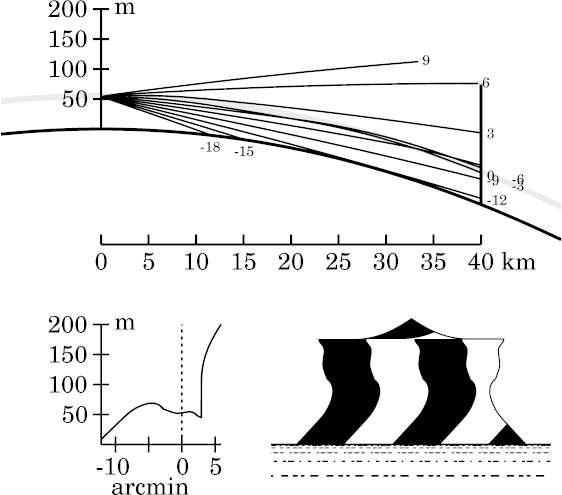
Because less of the inversion is available above eye level to trap inclined rays, the width of the miraging strip has appreciably decreased: the rays 3′ from the astronomical horizon are no longer ducted. The lower edge of the miraged strip has almost disappeared here.
The contrast with Wegener's
toy model
at the same geometry is quite pronounced, because the lapse rates at eye
level are so different in the two models.
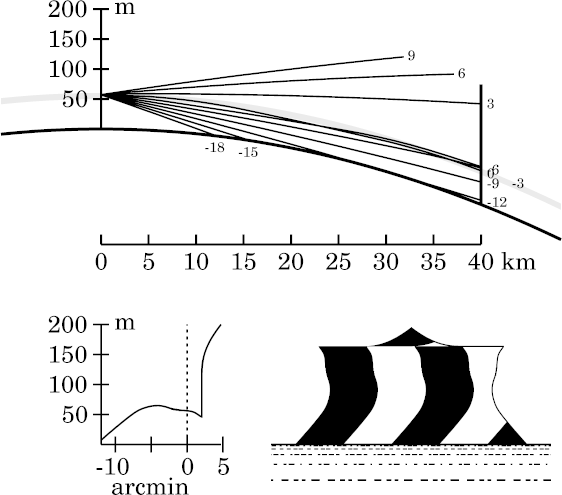
The ray diagram shows that the 0′, −3′, and −6′ rays all arrive at nearly the same height at the target. Thus, a small part of the target is enlarged to fill a wide band of the observer's field of view. This is why the image is so greatly stretched (towered).
Only two images of the miraged part of the target are apparent. Actually,
this is a 3-image mirage; but the upper erect image is so flattened that
it is not resolvable from the upper edge of the strip.
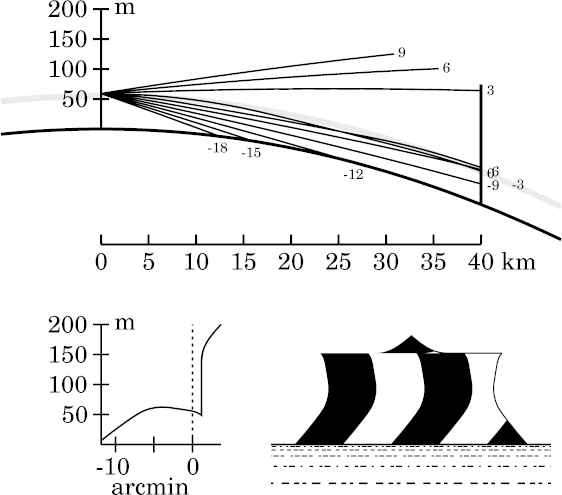
Wegener's toy model at the same geometry looks completely different, because it's dominated by the periodicity effect, while the zigzag model's mirage is primarily a large Nachspiegelung .
The transfer curve shows how the top of the miraged strip approaches the astronomical horizon as the observer approaches the top of the inversion.
With increasing height above the inversion, the inverted image gradually shrinks in size, and becomes more and more compressed (stooped).
These two cases show the transformation of the
Nachspiegelung
into a ducted mock mirage above the top of the inversion.
However, even the zigzag model is not sufficiently realistic to capture all the behavior of superior mirages. Its temperature profile is continuous, but not smooth. The physical constraints of heat transfer compel actual temperature profiles to be smooth (i.e., have a continuous first derivative).
So the corners of the zigzag profile must be rounded off. When this is done, there is a level at both the top and the bottom of the inversion where the curvature of a horizontal ray exactly matches that of the Earth; such a ray follows the curve of the planet at constant height. These orbiting rays, and their neighbors, produce some additional phenomena that actually appear in ducted mirages.
Copyright © 2008 – 2009, 2012, 2014, 2025 Andrew T. Young
or the
introduction to all mirage simulations
or the
main mirage page
or the
GF home page
or the website overview page