Wegener's Periodicity Effect
Introduction
The path of a ducted ray is strictly periodic: it oscillates between two
limiting heights, retracing the same shape over and over again (assuming
the atmospheric structure does not vary horizontally). This periodicity,
and the limiting heights, can be inferred from the
dip diagram
— which itself is just a consequence of the
refractive invariant.
Alfred Wegener
noticed that the length of the period (between corresponding parts of the
same ray path) depends in a remarkable way on the ray's altitude at the
observer. He then used this relationship to give a qualitative
explanation
of the distortions in superior mirages.
Wegener's relationship can also be used to infer other properties of
superior mirages, so it's worth detailed examination.
Wegener's reflection model
Alfred Wegener
developed a simple model for mirages and other refraction phenomena,
assuming that the thickness of a temperature inversion can be neglected.
Collapsing an inversion to zero thickness makes it a density discontinuity.
This oversimplified model replaces the actual refraction in the inversion
with a fictitious total internal reflection.
Wegener,
in his
1918 paper,
stated that
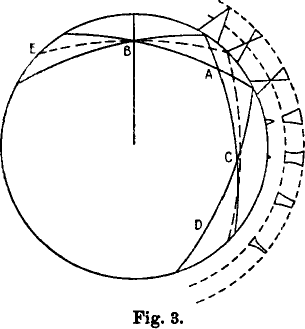 … the two points of reflection of the limiting rays at E, A
and D must … always be equally far apart, while the reflection point of
the horizontal ray is shifted back more at each new reflection. The path
of the rays is therefore not exactly symmetric at the reflection point A,
and at C only the two limiting rays intersect, while the horizontal ray
here runs somewhat above this intersection.
… the two points of reflection of the limiting rays at E, A
and D must … always be equally far apart, while the reflection point of
the horizontal ray is shifted back more at each new reflection. The path
of the rays is therefore not exactly symmetric at the reflection point A,
and at C only the two limiting rays intersect, while the horizontal ray
here runs somewhat above this intersection.
Notice that the two limiting rays — the two solid arcs that
intersect at the observer's position, at B — have the same shape;
they're just one another's reflections about the vertical line.
(This follows from the
symmetry
properties of refracted rays.)
As I've noted
elsewhere,
Wegener's figure is a little confusing; so I'll try to explain his idea
with simpler diagrams here.
Straight rays
First, let's go back to Wegener's
earlier
model, presented in his
1912 paper,
in which ray curvature is neglected, and the rays are drawn as straight
lines, instead of circular arcs. He justifies this approximation as
follows:
It's well known that the ray curvature is less than the Earth's curvature.
So, to be sure, one would obtain quantitatively false values if one
regarded the rays as straight; but qualitatively, the phenomena must
occur just the same way. If we imagine a cross-section through the Earth in
the plane of the ray, we can without difficulty “stretch” the
Earth's surface (i.e., increase the radius of curvature) until the
previously curved ray has become straight.
This is a very useful transformation; in fact, all the phenomena depend
locally just on the difference of the curvatures of the ray
and the Earth, so that subtracting out the ray curvature — which
makes the rays straight — is both permissible and convenient.
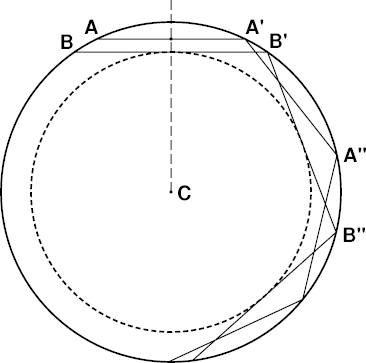 So here's Wegener's cross-section through the Earth, with center at C.
In my diagram at the left, the outer heavy circle
(BAA′B′A″B″…) is Wegener's density
discontinuity, and the dashed circle inside it is the bottom of the duct
— or, as Wegener described it, the envelope of the limiting rays.
The diagram at the left shows two ducted rays, AA′A″… and
BB′B″…, with different
perigee
heights.
BB′B″… is one of Wegener's limiting rays, which is
just barely trapped in the duct; any ray below BB′ is refracted at
Wegener's density discontinuity, instead of being reflected back into the duct.
So here's Wegener's cross-section through the Earth, with center at C.
In my diagram at the left, the outer heavy circle
(BAA′B′A″B″…) is Wegener's density
discontinuity, and the dashed circle inside it is the bottom of the duct
— or, as Wegener described it, the envelope of the limiting rays.
The diagram at the left shows two ducted rays, AA′A″… and
BB′B″…, with different
perigee
heights.
BB′B″… is one of Wegener's limiting rays, which is
just barely trapped in the duct; any ray below BB′ is refracted at
Wegener's density discontinuity, instead of being reflected back into the duct.
The lowest point on a ray is its perigee, where it's closest to C.
At the perigee point, the ray is locally horizontal (i.e., perpendicular
to the local vertical.)
The perigee points on the two ray segments AA′ and BB′
are their midpoints, which fall on the dashed vertical line that bisects
them. The period of the upper ray is just the interval AA′, or
A′A″; and the period of the lower ray is from B to B′ =
B′B″.
It should be obvious that the segment AA′ with the higher perigee is
shorter than BB′, so that the period of the higher ray is shorter
than the period of the lower ray. As BB′ here is a
limiting ray, its perigee is lower than that of any other
ducted ray, and its period is longer than that of any other ducted ray.
Notice that it's horizontal at the bottom of the duct (the heavy dashed
circle).
If we imagine an observer placed at the midpoint of AA′ (i.e. its
intersection with the dashed vertical), this ray is at the observer's
astronomical horizon. But to draw the observer's limiting rays,
at the edges of the
blank strip,
we have to rotate the limiting ray
BB′… about the center C until this ray passes
through the observer's position.
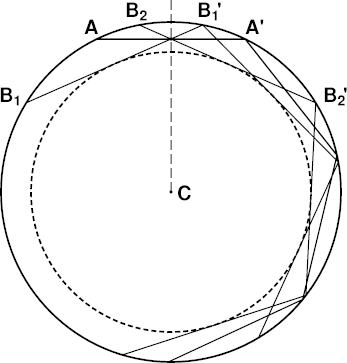 Here's what you get when you do that. In the figure at the right,
the observer is at the intersection of all the straight lines, at the
midpoint of the astronomical-horizon ray AA′. The two limiting rays that
define
Wegener's blank strip
are B1B1′
and B2B2′; the B1 ray is at the
top of the blank strip, and the B2 ray is at its lower edge,
if the observer looks to our right.
(Already, with just these two limiting rays, you can see why Wegener
described the bottom of the duct as the envelope of the limiting rays.)
Here's what you get when you do that. In the figure at the right,
the observer is at the intersection of all the straight lines, at the
midpoint of the astronomical-horizon ray AA′. The two limiting rays that
define
Wegener's blank strip
are B1B1′
and B2B2′; the B1 ray is at the
top of the blank strip, and the B2 ray is at its lower edge,
if the observer looks to our right.
(Already, with just these two limiting rays, you can see why Wegener
described the bottom of the duct as the envelope of the limiting rays.)
It's obvious in these last two diagrams that the period — i.e., the
interval between reflections at the discontinuity — of a ducted ray
depends on the ray's perigee height: the lower the perigee, the longer the
period. As the limiting ray BB′… is the lowest
possible ducted ray, it has the longest inter-reflection period.
So an observer's astronomical-horizon ray always has a shorter period than
the limiting rays. This shorter period makes successive reflections of
the horizon ray steadily fall behind, relative to the limiting rays
— and this mis-match between the horizon and limiting rays produces
an increasing distortion of the miraged image, as Wegener
noted.
Furthermore, the perigee height of an observer's astronomical-horizon ray
is just the observer's own height (see AA′…). But, while
observers at different heights have different horizon rays, all
observers have the same limiting rays, at the edges of the blank
strip; it's just the phasing (rotation about C) of the limiting rays, not
their shape, that changes with observer height. So, the higher the
observer is above the bottom of the duct, the shorter the period of the
horizon ray, and the bigger the difference between the periods of the
horizon ray and the limiting rays. That makes the distortions larger for
an observer nearer the top of the duct.
To put this another way: the closer the observer is to the top of the
duct, the bigger are the distortions produced by the periodicity effect.
Curved rays
As long as the curvature of rays below the density discontinuity is
less than the Earth's curvature, all the arguments offered above remain
valid. And, as Wegener
showed,
the distortion in the superior mirage depends on the difference in the
periods of the horizon and limiting rays; so, just as with straight rays,
the distortions are larger, the closer the observer is to the discontinuity.
This is exactly what we
see
in the simulations. The complexity of the
miraged image grows with the number of reflections of the horizon ray.
So for an observer near the bottom of the duct, the mirage is a simple
inverted image for nearby objects, and gradually becomes distorted and
multiple for distant ones. For an observer near the top of the duct,
the period discrepancy is large; so the complex images
appear at shorter distances.
Realistic models
But do any of these phenomena still occur when we use a more realistic
model atmosphere, instead of Wegener's impossible density discontinuity?
Even when the duct is produced by an inversion of finite thickness,
there is always a part of the duct below the base of the inversion.
In this lower region, Wegener's periodicity effect still occurs.
Of course, in the real atmosphere, we have to replace Wegener's
“reflections” with a continuous
bending back down of the rays within the inversion. So the period-discrepancy
effect is more complicated for an observer inside the inversion.
However, for observers between the base of the inversion and the bottom of
the duct, the effects predicted by Wegener, and discussed here, are still
observed.
A particularly important consequence of the periodicity effect is that, as
the rays at the center of the miraging zone at the astronomical horizon
get increasingly out of step with those at the edges, additional
transitions between inverted and erect images begin to appear in the
mirage, when the target is sufficiently far away. Thus,
multiple alternations of erect and inverted zones — a
hallmark of the Fata Morgana — are produced, even if there is only a
single inversion. The observer simply needs to be quite close beneath it.
The persistence of these properties of Wegener's simple model in
realistic situations makes Wegener's periodicity effect a useful tool in
understanding superior mirages, particularly those that are spectacularly
complex.
Copyright © 2008, 2009, 2012 – 2014, 2025 Andrew T. Young
Back to the . . .
introduction to Wegener's superior-mirage model
or the
introduction to mirage simulations
or the
main mirage page
or the
GF home page
or the
website overview page