Ducts
Introduction
The most spectacular atmospheric-refraction phenomena are produced by
ducts .
In terrestrial refraction, they produce
superior mirages
and
Fata Morganas;
in sunset displays, they produce Wegener's
blank strip
and the long-lasting
sub-duct green flash.
Here's a table with links to some of the pages that use ducts:
In addition, there are discussions of the sunset
transfer curves
of ducts; the relations of ducts to the
dip diagram,
and to the
refractive invariant;
and a slightly
more detailed introduction
to ducting in sunsets.
So there are references to ducts all through these Web pages.
But this has left the information about ducts scattered over many pages.
It's useful to have basic information about ducts and ducting in a single
location. That's this page, which also has many links to details
on other pages.
(Remember
that links in Italics refer to the
glossary ,
and that links in boldface refer to the very long
bibliography
and so may be slow to load.)
A little history
Although the optical phenomena of ducts (notably, superior mirages
and Fata Morganas) have been known for thousands of years, the term
duct wasn't introduced until the 1940s, when radar operators in
World War II began observing returns from objects far beyond the normal
horizon. (This is called
“anomalous
propagation”
by the radar
people; in meteorological optics, it's the well-known phenomenon of
looming .)
The
textbook
example is the observation of the coast of
Arabia by a 200-MHz radar in Bombay, India, 1700 miles away.
Because wave-optical effects are important at radio and even microwave
frequencies, these early observations were compared to propagation in a
waveguide — so the word duct was a natural analogy.
Here's a brief explanation from one of the earliest papers on the subject:
In a nonhomogeneous atmosphere whose index of refraction decreases with
height, rays of sufficiently small initial elevation angle are refracted
downward with a curvature proportional to the rate of decrease of the
index of refraction with height. If the radius of curvature is less than
the radius of the earth, such rays reach a maximum height and are
confined, or trapped ,
between this height and the earth's surface.
This process is referred to as trapping , and the region of the
atmosphere within which it occurs is called a duct ,
because of the analogy with wave-guide propagation.
— M. Katzin, R. W. Bauchman, and W. Binnian
“3- and 9-centimeter propagation in low ocean ducts”
Proceedings of the Institute of Radio Engineers 35,
891–905 (1947)
However, the basic phenomena of ducting were mentioned by
Biot (1810
and
1836)
and
Radau (1882),
and discussed in detail by
Kummer (1860)
and
Wegener
(1912 and 1918), in the context of atmospheric refraction and mirages
— all, of course, without using the term “duct”.
More recently, the word “duct” has been
adopted in the optical literature as well [cf. the
Meinels'
(1984)
book review].
How ducting works
Because optical refraction depends almost entirely on the
temperature profile
of the air, optical ducts are only produced when there's a steep
thermal inversion
in which the
lapse rate
is more negative than a critical value
(near
−0.11°C/m, for typical conditions).
Elsewhere on these pages, I've used
a rather mild inversion
of 2°C
between 50 and 60 m height, whose lapse rate (−0.20°/m)
is nearly twice the critical value. Here, I'll use an even steeper
inversion of 5° in the same interval of height, to make the ray
diagrams clearer.
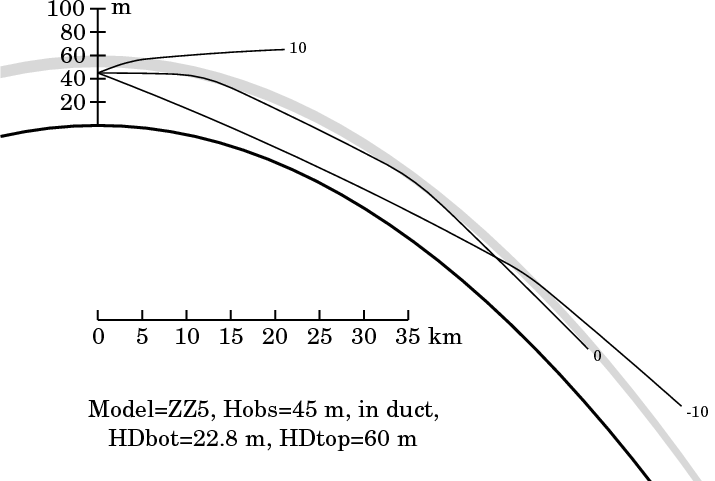 The diagram at the left shows this example. The heavy curved line
represents the surface of the Earth. Just the lowest 100 m of the
atmosphere are shown (see the scale at the upper left of the diagram),
with a vertical exaggeration of about 100× (see the horizontal scale
of kilometers).
The shaded band above the Earth's surface represents the
thermal
inversion
of 5° between 50 and 60 m height.
The diagram at the left shows this example. The heavy curved line
represents the surface of the Earth. Just the lowest 100 m of the
atmosphere are shown (see the scale at the upper left of the diagram),
with a vertical exaggeration of about 100× (see the horizontal scale
of kilometers).
The shaded band above the Earth's surface represents the
thermal
inversion
of 5° between 50 and 60 m height.
Three rays are traced in this model atmosphere, from the position of
an observer placed 45 m above the ground, on the height scale at
the left. The right end of each ray is marked with the ray's angular
altitude
at the observer in
minutes of arc: 0 for the ray at the observer's
astronomical
horizon ,
and rays 10′ above and below it.
Notice that the rays at 10′ and −10′ are refracted
inside the shaded inversion layer, but pass completely through it.
However, the horizon ray is quickly bent back down when it enters the
inversion, so that it returns to its original height (45 m) after
about 24 km. Then the pattern repeats: the ray again enters the
inversion and is bent back down near 36 km; it again returns to the
original height near 48 km; and so on. This ray is trapped ,
or ducted.
This ducted horizon ray has most of its path below the inversion
layer, which means that the bottom of the duct is lower than the bottom of
the inversion. (The bottom of the duct is discussed in detail
below.)
 Clearly, even rays with a considerable slope — though somewhat less
than 10′ — can also be bent back into the region below the
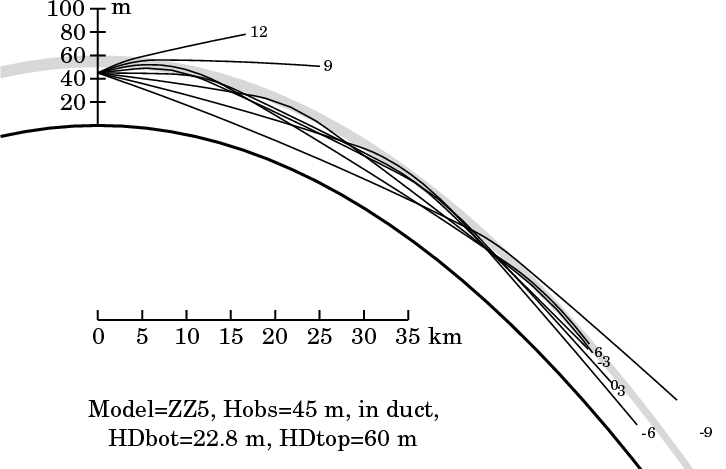
inversion layer, and trapped there. The diagram at the right shows rays
at 3′ intervals in altitude, for the same observer and model
atmosphere as before. While the rays at +12′ and ±9′
pass through the inversion, those with slopes of 3′ and 6′
at the observer are trapped, or ducted.
Clearly, even rays with a considerable slope — though somewhat less
than 10′ — can also be bent back into the region below the
inversion layer, and trapped there. The diagram at the right shows rays
at 3′ intervals in altitude, for the same observer and model
atmosphere as before. While the rays at +12′ and ±9′
pass through the inversion, those with slopes of 3′ and 6′
at the observer are trapped, or ducted.
You can see that the rays 6′ from the observer's horizon
(which peak near 8 and 35 km from the observer) penetrate
farther into the inversion — i.e., closer to its upper surface
— than those only 3′ from it. (e.g., the −3′ ray,
whose apex is near 23 km).
Also, notice how the ducted rays all come together about 44 km from
the observer. The duct acts like a lens, focusing these rays into a
crude image at this distance. This focusing effect produces the vertical
exaggeration of images in
superior mirages.
(When the focusing is sharp, the greatly extended vertical images of
objects near the exact imaging distance form the striated zone of the
Fata Morgana.)
Depth of the duct
In discussing the trapped horizon ray for the 45-m observer
above,
we noticed that it barely penetrated into the lower edge of the inversion
layer. So this ray oscillates between heights of 45 and about 52 meters.
All the other trapped rays in the
second diagram
pass below the observer's height, but don't reach the ground.
So the bottom of the duct is somewhere between the observer and the
ground. Just how low can a trapped ray go?
This question is answered in the labels on these diagrams: the top of
the duct is the top of the inversion, at 60 m; but the bottom of
the duct is far below the 50-m base of the inversion —
it's at 22.8 m for this model atmosphere. (Wegener called the
difference between the heights of the top and bottom of the duct its
“effective depth” in his
1918 paper.)
The base of the duct can be found from the atmospheric model: it's the
height at which the product nR (where n is the
index of refraction
of air, and R is distance from the center of curvature
of the atmosphere) has the same value as at the top of the inversion.
The product nR is the
refractive invariant
for horizontal rays at each height; a plot of these values against
height gives the
dip diagram.
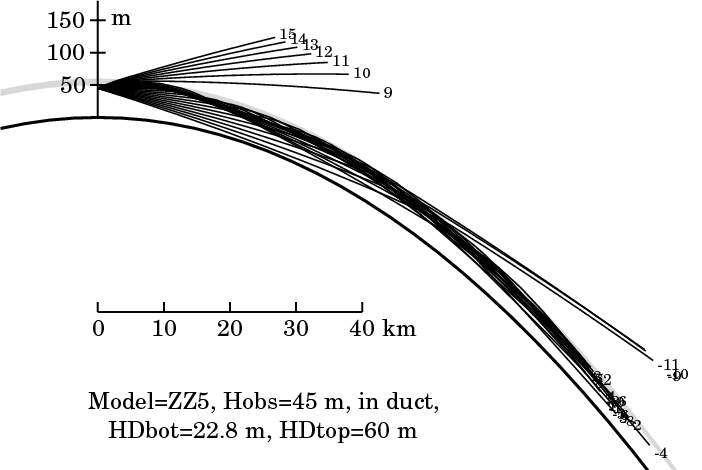 It's instructive to plot rays for every minute of arc in altitude at the
observer; that's the diagram at the left here, which shows the lowest 180
meters of the atmosphere. You can see three groups
of rays: (1) those with altitudes at the observer of 9′ and more, which
pass through the inversion without trapping; (2) those that lie within
8′ of the observer's astronomical horizon, which are all trapped in the
duct; and (3) those at least 9′ below the horizon —
here, the rays at −9′, −10′, and −11′,
which initially pass below the inversion, approach the ground, but then
pass back up through the inversion without being trapped.
(Rays 12′ or more below the horizon strike the Earth's surface
within about 24 km of the observer, and are not shown.)
It's instructive to plot rays for every minute of arc in altitude at the
observer; that's the diagram at the left here, which shows the lowest 180
meters of the atmosphere. You can see three groups
of rays: (1) those with altitudes at the observer of 9′ and more, which
pass through the inversion without trapping; (2) those that lie within
8′ of the observer's astronomical horizon, which are all trapped in the
duct; and (3) those at least 9′ below the horizon —
here, the rays at −9′, −10′, and −11′,
which initially pass below the inversion, approach the ground, but then
pass back up through the inversion without being trapped.
(Rays 12′ or more below the horizon strike the Earth's surface
within about 24 km of the observer, and are not shown.)
The ducted rays gradually get
out of step
with one another, and fill up the duct. You can see this beginning to
happen in the right half of the present diagram. (Compare the
22.8-m height of the bottom of the duct with the height of the lowest rays
in this region.) The lowest level reached by a ducted ray is the bottom
of the duct.
Finally, notice the big gap above the inversion between the two groups
of rays that pass up through the duct. This is a region that's invisible
from the observer's position. If a radar transmitter were where our
observer is, it couldn't illuminate targets in this gap; so radar
operators call this region a “shadow zone”. Optically, it
corresponds to the zone of sky blocked by Wegener's
blank strip.
Inversions and ducts
It's important to distinguish between the base of an inversion
and the base of the duct it produces. While the top of the duct
coincides with the top of the inversion, the bottom of the duct is always
below the bottom of the inversion. That's because a ray that's
horizontal just below the top of the duct has a considerable slope at
the bottom of the inversion, as can be seen from the
dip diagram. Specifically, notice that the
observer at 45 m in the example
above is inside the duct,
but below the bottom of the inversion:
the bottom of the duct is at a height of 22.8 m;
but the bottom of the inversion is at 50 m.
Also, notice that an optical duct always requires an inversion to produce
it, because the optical refractivity of air depends on its temperature.
But the reverse is not true: that is,
not every inversion produces
a duct. The lapse rate of the inversion must exceed a certain critical
value (which is readily
calculated)
to produce enough bending to trap rays. This critical value is
typically
about −11°C per hundred meters, for average conditions
in moderate latitudes near sea level.
That is, the air temperature must increase with height at a rate greater
than 0.11° per meter to produce a duct. That doesn't sound like much;
and in fact, such inversions
occur quite often
in the lower atmosphere. Such an inversion is sometimes called
“super-refracting”, because the curvature of a horizontal ray
in it exceeds the curvature of the Earth.
Elevated and surface-based ducts
The duct shown in the diagrams above is called an elevated duct;
its lower boundary is above the ground (by more than 20 meters). If the
inversion had been stronger, or considerably lower, the Earth's surface
would have been inside the duct. Then the duct would have been a
surface-based duct, instead of an elevated one. (The
“low-level” radar ducts described in the
quotation
at the beginning of this page were surface-based ducts.)
There's a little more discussion of elevated and surface-based ducts on
the anomalous horizons page.
Differences between optical and radio ducts
The main difference between ducting at optical and radio wavelengths is
due to water vapor's effect on the refractive index of air. In
visible light, water vapor hardly changes the
refractivity of air
at a fixed pressure and temperature. But the radio refractivity is
strongly affected by the R(0) line of the pure-rotation spectrum of water
vapor, at 1.35 cm wavelength. At longer wavelengths — which
includes almost all radio and radar work — the refractivity is
considerably increased by even small amounts of water vapor.
Consequently, while the optical refractivity of air depends mostly on the
temperature profile,
the radio refractivity depends mostly on the absolute
humidity profile. As the amount of water vapor decreases with height
much more rapidly than the density of the atmosphere in general, the radio
refractivity gradient is typically about twice as strong as the optical
one. So, while the
curvature
of visible light is typically about 1/6 that of the Earth's surface, the
curvature of radar beams is about 1/3 that of the Earth.
This means that radio waves need less deviation from average conditions to
produce a duct, compared to visible light.
Besides differences in refractivity, and the greater importance of
wave-optical effects at radio frequencies, one should be aware of another
significant difference between the behavior of radio waves and light:
the ocean
absorbs
most of the light that strikes it; but it reflects radio waves.
So, while radio waves can travel for thousands of kilometers in a
surface-based duct, the analogous optical structure produces a superior
mirage of the sea surface only a few kilometers away from the observer.
It can also produce a “false horizon” with negative
dip
— i.e., what
Hasse (1960;
1964)
called a
Kimmfläche or “horizon surface”.
(This is just the upper edge of Wegener's
blank strip
when the lower edge is hidden by the
apparent horizon ).
However, when the low-Sun glitter path is miraged in this way,
spectacular
images
can be produced (use that link to see one, in a video by Mila Zinkova).
This phenomenon, a
Fata Morgana
of the sea surface, is discussed in detail by Siebren van der Werf in his
2017 paper.
More details
For more detailed discussions of ducting phenomena in sunsets, see the
simulations,
and the examples of sunset
transfer curves.
Summary: What's a duct?
A duct is an atmospheric structure that traps rays within a few
minutes of arc
of the
astronomical
horizon ,
so that they cannot escape from the atmosphere, but are
periodically bent back down, so as to follow the curvature of the Earth. The
bending
is produced by a steep
thermal
inversion .
The inversion can do this if its
lapse rate
is more negative than a critical value (near
−0.11°/m, for typical conditions).
Copyright © 2009 – 2014, 2019, 2020, 2022, 2026 Andrew T. Young
Back to the ...
understanding atmospheric refraction page
or the
introduction to mirages
or the
Overview page